
Display any Chart on a Board.
![]() REQUIRED: The Chart Module is required to perform the functions on this support page. Reach out to your Customer Success Manager to enable Charts for your organization.
REQUIRED: The Chart Module is required to perform the functions on this support page. Reach out to your Customer Success Manager to enable Charts for your organization.
A Chart Card is a Card that displays any Chart in KaiNexus. Charts Cards are a great way of making sure that people who access a Board see important KPIs or other metrics recorded on Charts.
![]() Pro Tip: A person without permission to see the Chart itself won't be able to see the data on the Chart Card either.
Pro Tip: A person without permission to see the Chart itself won't be able to see the data on the Chart Card either.
Keep reading to learn about the following:
- Adding a new Chart Card to a Board
- Editing the data of a Chart via a Chart Card
- Annotating Charts via a Chart Card
- Configure the Card's View
- How Chart Cards are affected by the Board's filters
- How to view the Item associated with your Chart Card
Add a new Chart Card
Who can add a Chart Card to a Board?
- The Board's Owner, if they have the "Create Boards" permission.
- The Board's Editors, if they have the "Create Boards" permission.
- Anyone with the "Board Administrator" permission for Boards in that Board's Location.
- If you're adding an existing Chart to the Board, you must also have permission to view the Chart. Only the following people can view a Chart:
- Anyone on the Chart's Team.
- If the Chart is not private and not in the New status, anyone with the "View" permission for Items in the Chart's Location(s).
- If the Chart is private, anyone with the "View Private" permission for Items in the Chart's Location(s).
- If the Chart is in the New status and is not private, anyone with the "View New" permission for Items in the Chart's Location(s).
- If you're adding a new Chart to the Board, you must also have permission to create that kind of Chart.
![]() NOTE: Boards can have at most 16 Cards. Once a Board has 16 Cards, you won't be able to add (or copy) additional Cards to it.
NOTE: Boards can have at most 16 Cards. Once a Board has 16 Cards, you won't be able to add (or copy) additional Cards to it.
Add a Chart Card
To add a Chart Card, navigate to the Board with which you want to work, then:
- Click Add in the top right corner of the page.
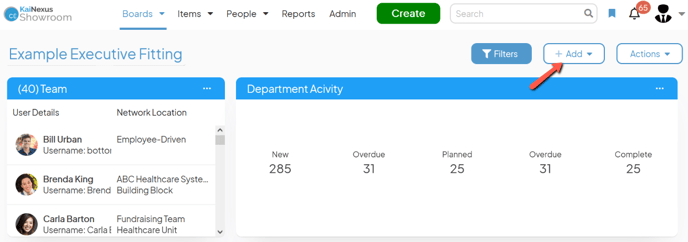
- Click Chart in the resulting drop-down menu and the Chart Card window will open:
- To create a new Chart from scratch, click Create, and choose a template and type of Chart. Then create the Chart as you normally would. When you're finished, the Chart will be created and the Chart Card will be added to the Board.
- To add a Card for a Chart that already exists, use the Choose Existing field to search for and select that Chart, then click Add.
Edit a Chart's data via a Chart Card
Who can edit a Chart via a Chart Card?
To edit a Chart's data from a Chart Card, you must have permission to edit the Chart and permission to edit the Card.
The following users can edit a Chart:
- Anyone on the Chart's Team except for Followers or Participants.
- Anyone with the “Edit” permission for Items in the Chart's Location(s).
The following users can edit a Card:
- The Board's Owner
- The Board's Editors
- The Card's Editors
- Anyone with the "Board Administrator" permission for Boards in the Board's Location
- Anyone who can access the Board and has the "Card Administrator" permission in the Card's Location
Edit data via a Chart Card
There are two ways you can edit Chart data from a Card. Both options take you to the same data entry window.
Option One:
- Hover over the header of your Chart Card. A + icon will appear.
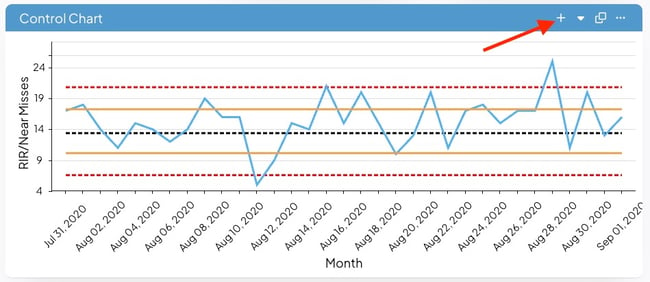
- Select the + icon. The Chart's data entry window will open.
- Make any changes to the Chart and select Save.
Option Two:
- Select the ellipsis in the top right corner of the Card.
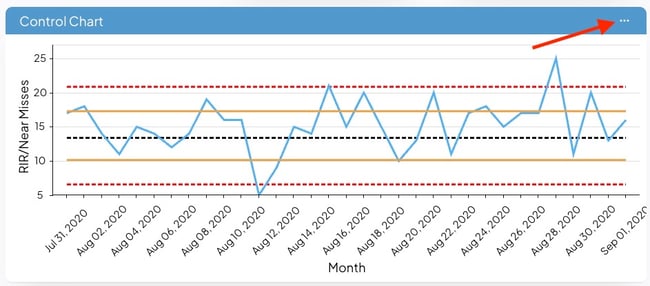
- Select Edit Chart in the resulting drop-down menu. The Chart's data entry window will open.
- Make any changes to the Chart and select Save.
![]() Important: For more information on working with Charts' data, check out the articles for each type of Chart: Threshold, Control Limit, Bowling, Bar/Line, or Pareto.
Important: For more information on working with Charts' data, check out the articles for each type of Chart: Threshold, Control Limit, Bowling, Bar/Line, or Pareto.
Add and view Annotations
If you have Chart Card on a Board, you can work with Annotations directly from the Card itself without having to first expand the Chart.
![]() To learn everything there is to know about Annotations (what they are and how you can configure them), check out this article.
To learn everything there is to know about Annotations (what they are and how you can configure them), check out this article.
Who can annotate a Chart?
- Anyone on the Chart's Team except for Followers or Participants.
- Anyone with the “Edit” permission for Items in the Chart's Location(s).
View Annotations
An annotated data point will be outlined in a pre-determined color. Hovering over that data point will reveal a tooltip containing a summary of its first five Annotations.
Click the data point to open a list of all its Annotations, showing any linked items or notes included in each. Click the name of a linked item on this list to open that item.
Add an Annotation
To add an Annotation to a Chart on a Chart Card, navigate to the Board containing that Chart Card, then:
- Click the exact data point you wish to annotate.
- Click Add Annotation in the resulting window. The "Add Annotation" window will open.
- Item: If you want to link an item, add it to the “Item” field. You can only add one item per Annotation, so if you want to link multiple items to a particular data point, you’ll need to add multiple Annotations.
- Note: If you want to add a comment, enter it in the “Note” field.
- Click Save. This Annotation will be added to the selected data point.
Change a Chart Card's View
Who can configure the appearance of a Chart Card?
Only the following people can edit the appearance of a Chart Card:
- The Board's Owner, if they have the "Create Boards" permission.
- The Board's Editor(s), if they have the "Create Boards" permission.
- The Card's Editors
- Anyone with the "Board Administrator" permission for Boards in this Board's Location.
- Anyone who can access the Board and has the "Card Administrator" permission for Cards in the Card's Location.
Switch between Chart View and Bowling View
If a Chart Card typically shows a graphical representation of your data, you may occasionally want to see the Bowling View instead, or vice versa. This change will only affect your KaiNexus session and will only last until the Card next loads.
To switch between Views, locate the Card with which you want to work, then:
- Click the ellipsis in the top right corner of the Card.

- Hover over View in the resulting drop-down menu and the menu will further expand.
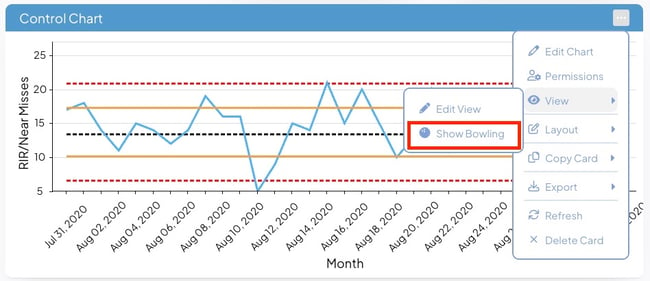
- Click Show Bowling if the Card is in Chart View and you want to switch to Bowling View.
- Click Show Chart if the Card is in Bowling View and you want to switch to Chart View.
Configure the Chart Card's settings
![]() Important: Changes made here will only affect the configuration and appearance of this Chart Card, not the Chart itself or any other Chart Cards displaying it.
Important: Changes made here will only affect the configuration and appearance of this Chart Card, not the Chart itself or any other Chart Cards displaying it.
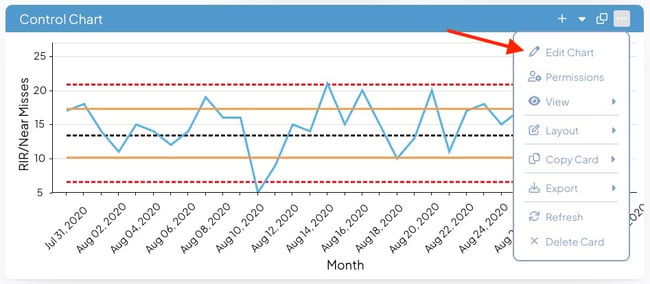
- Select the ellipsis in the top right corner of the Card.

- Hover over View in the resulting drop-down menu and the menu will further expand.
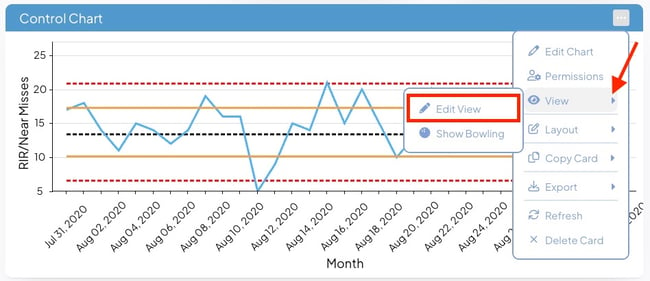
- Click Edit View, and the Edit Chart Card View window will open.
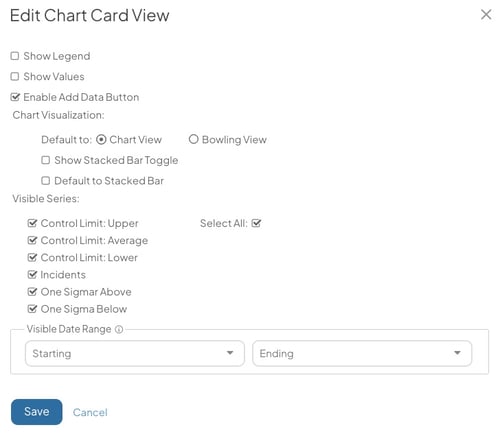
- The Show Legend checkbox: When this box is checked, the Chart's legend will be included on this Card. If enabled, a new option will appear beneath the checkbox:
- Position: Expand the drop-down to choose whether the legend should be displayed above, below, to the left, or to the right of the Chart.
- The Show Values checkbox: When this box is checked, the values of any data series configured on the Chart itself to show its values will appear on the Chart Card. If no data series has been configured in this way, this checkbox will have no effect.
- Under the Chart Visualization header:
- Default to: Click either the Chart View or Bowling View radio button to decide in which view this Chart should be displayed by default.
- The Show Stacked Bar Toggle checkbox: When this box is checked, a "Show Stacked" option will appear by the Chart's legend. Clicking "Show Stacked" will toggle the stacked bar visualization on and off.
- If the Chart doesn't have multiple bar series, this will have no effect on its appearance.
- The Show Legend checkbox: When this box is checked, the Chart's legend will be included on this Card. If enabled, a new option will appear beneath the checkbox:
-
-
- The Default to Stacked Bar checkbox: When this box is checked, the stacked bar visualization will become the default view.
- If the Chart doesn't have multiple bar series, this will have no effect on its appearance.
- The Default to Stacked Bar checkbox: When this box is checked, the stacked bar visualization will become the default view.
-
/Ofie/Ofie%20Profile%20Pic.png?width=50&height=50&name=Ofie%20Profile%20Pic.png) Warning: The Show Legend checkbox must be checked for the "Show Stacked" or "Toggle Date Range" options to appear on the Chart Card.
Warning: The Show Legend checkbox must be checked for the "Show Stacked" or "Toggle Date Range" options to appear on the Chart Card.
-
- Visible Series: Each of the Chart's data series will be listed alongside a checkbox. Check the checkbox of each series that should be displayed on the Chart Card.
-
- Under the Visible Date Range header:
- Starting: Data preceding the date entered here will not be shown on the Chart Card by default, but a "Toggle Date Range" option will appear by the Chart's legend. Clicking "Toggle Date Range" will toggle the date range filter on and off.
- Ending: Data from after the date entered here will not be shown on the Chart by default, but a "Toggle Date Range" option will appear by the Chart's legend. Clicking "Toggle Date Range" will toggle the date range filter on and off.
- Changes made here will not affect the appearance of a Chart that uses categories instead of dates.
- Under the Visible Date Range header:
Pro Tip: You can also set a Visible Date Range in the Edit Chart window when you select Options. This will only adjust the date range on the Chart's Item Work Panel, not the Chart Card. You must update the Visible Date Range in the Card's Edit View window to define the date range on a Card.
-
- Click Save to update the appearance of the Chart Card.
How are Chart Cards affected by filters on the Board?
- If the Board is using a Location filter, any shared series from a Chart outside the selected Location(s) will disappear from the Board's Chart Cards.
- Chart Cards are not affected by other Board filters.
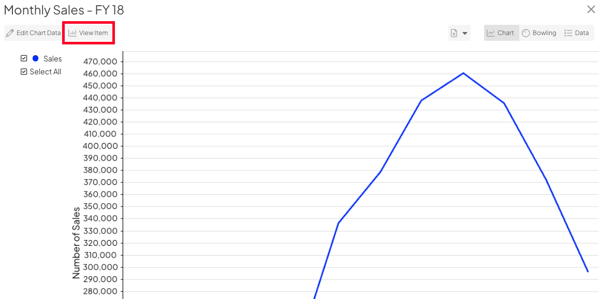
How do I view the Item associated with my Chart Card?
Each Chart Card in KaiNexus has a corresponding Item. Whether you are editing Chart data from the Card or from the Item, the updates are carried over between the two features.
It is helpful to view a Chart's Item Work Panel when you want to leave a Comment about the Chart, view Team members working on the Chart, or review the Chart's Timeline.
To view the Item Work Panel for your Chart Card:
- Select the expand icon to expand the Card.
- Select View Item.
Recommended Reading
If you want to learn more about Charts, check out these articles:
If you want to learn more about Cards, check out these articles:
- Customize a Card's headers
- Move a Card
- Copy a Card
- Export a Card
- Delete a Card
- Add permissions to a Card