![]() Warning: Your organization must have Charts enabled for at least one Template to perform the actions on this support page. Contact your Customer Success Manager if you'd like to start using Charts.
Warning: Your organization must have Charts enabled for at least one Template to perform the actions on this support page. Contact your Customer Success Manager if you'd like to start using Charts.
A Shared Data Series is a series that copies data from a series on another Chart in KaiNexus. As the data on that original Chart is updated, those changes will be reflected on every Chart that references it.
Data shared from one Chart to another can only be edited from the original Chart, so there's no risk of a data mismatch over time.
Annotations added to a series on one Chart will not be visible on any other Charts to which it was shared, keeping Charts from becoming cluttered with irrelevant Annotations.
By streamlining data collection in this way, visibility into data is increased and collaboration is simplified, all while maintaining data integrity.
What kinds of data series can be shared?
Standard data series can be shared across Charts to reuse the same underlying data set in multiple Charts.
Threshold and Bowling series can also be shared to reuse common Baselines and Thresholds/Targets across multiple Threshold or Bowling Charts.
Control Limit series cannot be shared.
When sharing a series, the series Row Type must be compatible with the Row Type used by the destination Chart. If the Row Types do not match, an error will occur. See the common errors section below for troubleshooting information.
Who can share a series with a Chart?
To share a series with another Chart, you must have permission to edit the new Chart and view the original Chart.
Only the following people can edit the new Chart's data:
- Anyone on the Chart's Team except for Followers or Participants.
- Anyone with the “Edit” permission for Items in the Chart's Location(s).
Only the following people can view the original Chart:
- Anyone on the Chart's Team.
- If the Chart is not private and not in the New status, anyone with the "View" permission for Items in the Chart's Location(s).
- If the Chart is private, anyone with the "View Private" permission for Items in the Chart's Location(s).
- If the Chart is in the New status and is not private, anyone with the "View New" permission for Items in the Chart's Location(s).
![]() For more information on Team Roles (like Authors, Facilitators, Participants, and more!) check out this article.
For more information on Team Roles (like Authors, Facilitators, Participants, and more!) check out this article.
Common questions
What happens when I copy a Chart that includes a shared series?
The shared series will be included in the new copy. You may need to save the new copy's data once before the shared series's data will populate, though.
What happens to my shared series if the original Chart is deleted?
If the original Chart is deleted, any shared series that pulled its data from that Chart will be deleted as well.
How do I spot a shared series on my Chart?
You'll be able to recognize a shared series in two ways:
- Its data will be grayed out and uneditable on the Edit Data window.
- Its name will be accompanied by a network icon in the Chart's legend. Clicking that icon will open the original Chart.
Create a Shared Series
Standard data series and Threshold and Bowling series can be shared between Charts.
Shared Data Series
To create a new shared data series, open the Chart with which you want to work, then:
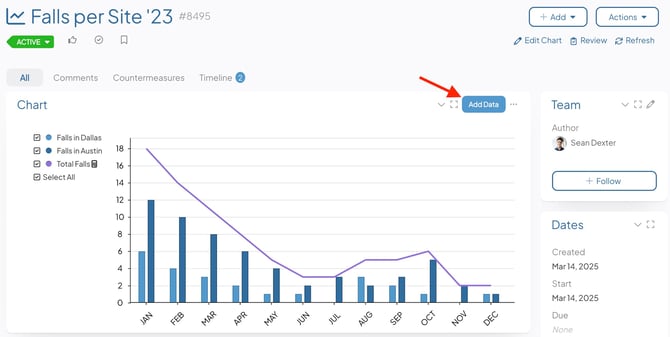
- Select the Add Data button at the top right of the Chart Panel. This opens the Chart's Edit Data window.
![]() If you need to build out your Chart in its entirety, check out the articles for your type of Chart: Threshold, Control Limit, Bowling, Bar/Line, or Pareto. If your Chart is already built and you just need to add a shared data series, proceed.
If you need to build out your Chart in its entirety, check out the articles for your type of Chart: Threshold, Control Limit, Bowling, Bar/Line, or Pareto. If your Chart is already built and you just need to add a shared data series, proceed.
- Click Add Data Series. The "Add Data Series" window will open:
- Name (required): The name will be used to identify this series.
- Description: Enter an optional description in this field. The description will appear when hovering over the name of the series on both the Edit Data window and on the Chart's legend.
- Format (required): Expand the drop-down to choose in which format you want data in this to be displayed. Once you've made a choice, the predefined format will appear in the field. Edit that predefined format to configure the appearance of this series's data further.
- Under the Type header:
- Click either the Line or Bar radio button to decide whether this series should be displayed as a line or as a bar.
- Click the Appearance header to open that section. The options shown here will be largely determined by your choice of line or bar above.
- If this is a line data series:
- Bar/Line Color: Click inside the color code field to open the color picker, choose in which color this series will be displayed, then click Save on the color picker.
- Line Width: The value (1–10) entered here will determine the width of this series's line on the Chart.
- The Show Markers checkbox: When this box is checked, a round marker will appear at each data point on the series's line on the Chart.
- The Show Values checkbox: When this box is checked, the value of each data point on this series will appear by its line on the Chart.
- If this is a line data series:
![]() "Show Markers" or "Show Values" can be enabled. They cannot both be enabled for the same series.
"Show Markers" or "Show Values" can be enabled. They cannot both be enabled for the same series.
-
-
-
- The Send to Back checkbox: When this box is checked, this series's line will be arranged behind any other series on the Chart.
- The Dashed Line checkbox: When this box is checked, this series will be displayed as a dashed line rather than a solid line.
- The Fill checkbox: When this box is checked, the space beneath the series's line will be filled in on the Chart. If enabled, the following options will appear beneath the checkbox:
- Fill Color: Click inside the color code field to open the color picker, choose in which the fill for this series will be displayed, then click Save on the color picker.
- Fill Opacity: Expand the drop-down to choose with what opacity you want the fill to be displayed.
- If this is a bar series:
- Bar/Line Color: Click inside the color code field to open the color picker, choose in which color this series will be displayed, then click Save on the color picker.
- The Show Values checkbox: When this box is checked, the value of each data point on this series will appear by its bar on the Chart.
-
- Click the Y-Axis header to open that section.
- Click either the Left or Right radio button to decide whether Y-axis for this series should be displayed on the left or right side of the Chart.
- The Shared Series checkbox: Check this box to turn this series into a Shared series. The data on such a series will not be editable on this Chart but will reflect updates made to the data series on the original Chart. If checked, the additional fields will appear:
- Chart: Use this field to search for the Chart which contains the series you want to have shared. Once you've selected a Chart, the next field will be enabled.
- Series: Expand the drop-down to select which data series from the specified Chart you would like to add.
- Click the Annotation Appearance header to open that section.
- Click inside the color code field to open the color picker, choose in which color Annotations on this series will be displayed, then click Save on the color picker.
- Click Save to create the data series and return to the Edit Data window.
- Repeat this process for any additional data series you need to add.
- Click Save on the Edit Data window to update the Chart.
-
Shared Threshold and Bowling Series
To create a new shared data series, open the Chart with which you want to work, then:
- Select the Add Data button at the top right of the Chart Panel. This opens the Chart's Edit Data window.
- Select Add Bowling Series or Add Threshold Series.
In the Bowling or Threshold Series window:
- Name (required): The name will be used to identify this series.
- Description: Enter an optional description in this field. The description will appear when hovering over the name of the series on both the Edit Data window and on the Chart's legend.
- The Shared Series checkbox: Check this box to turn this series into a Shared Series and mirror a Bowling or Threshold Series from another Chart. Shared Series automatically reflect updates made to the original series, meaning Target, Threshold, and Baseline values cannot be edited directly on this Chart.
If checked, the additional fields will appear:- Chart: Search for and select the Chart containing the series you want to mirror. After selecting a Chart, the Series field will become available.
- Series: Select the specific Bowling or Threshold Series you want to mirror from the chosen Chart. Only Bowling or Threshold Series matching the type of series you are currently editing will be available for selection.
After selecting a Shared Series, most series settings will be inherited from the original series and can no longer be edited on this Chart. Only Format and Annotation Appearance settings remain editable locally.
- Format (required): Expand the drop-down to choose in which format you want data in this to be displayed. Once you've made a choice, the predefined format will appear in the field. Edit that predefined format to configure the appearance of this series's data further.
- Click the Annotation Appearance header to open that section.
- Click inside the color code field to open the color picker, choose in which color Annotations on this series will be displayed, then click Save on the color picker.
- Click Save to create the series and return to the Edit Data window or click Save & Add Data Series to create the series and immediately open the "Add Data Series" window.
Common errors
Every Chart in KaiNexus is configured with a Row Type — either dates or categories. When sharing a data series with another Chart, the Row Type of the series (and therefore of the original Chart) must match the Row Type of the new Chart. If these two Row Types don't match, one of the following errors will appear.
Mismatched Series Error
If you attempt to share a series that uses the wrong Row Type, you'll get a Mismatched Series Error. If you still want to share the series with the new Chart, you'll either need to:
- Change the new Chart's Row Type to match the original Chart, or
- Change the original Chart's Row Type to match the new Chart.
Row Type Error
If you attempt to change the Row Type of a Chart that already has a shared series on it, you may get a Row Type Error. If you still want to share the series with the new Chart, you'll need to:
- Remove the shared series from the new Chart.
- Change the Row Type on the new Chart as desired.
- Change the Row Type on the original Chart to match that of the new Chart.
- Reshare the series with the new Chart.
Circular Reference Error
A circular reference is created when one data series has already been shared from Chart A to Chart B, and you try to share a second series from Chart B to Chart A. When you attempt to save a Chart with a circular reference, you'll get a Circular Reference Error as the two Charts get stuck in an endless loop of referring to one another.
Due to the continuous self-referencing and potential for data loss, KaiNexus does not support the configuration for circular references within Charts. To fix this error, you'll need to remove one of those shared series.