![]() Warning: Your organization must have Charts enabled on at least one Template to perform the actions on this support page. Contact your Customer Success Manager if you'd like to start using Charts.
Warning: Your organization must have Charts enabled on at least one Template to perform the actions on this support page. Contact your Customer Success Manager if you'd like to start using Charts.
If your Chart is using date-based (as opposed to category-based) rows of data, you can configure the Chart to only show a particular range of dates.
This is particularly useful if the Chart has a huge amount of data points. For example, if it has a data point from every week for the past three years, you may want to keep all that data but only need to display the data from the last 12 months. By limiting the date range, you can leave the historical data untouched and available to peruse with just a click while only displaying the most relevant dataset by default.
![]() PRO TIP: You can also set the visible date range for any of your Chart Cards. The process described on this page only affects the display of the Chart on the Item Work Panel, not any Chart Cards. If you plan to set a date range on a Chart Card, then we recommend leaving the date range on the Item undefined or identical to the Card. This will help prevent confusion when moving between the Chart Card and the Chart Item.
PRO TIP: You can also set the visible date range for any of your Chart Cards. The process described on this page only affects the display of the Chart on the Item Work Panel, not any Chart Cards. If you plan to set a date range on a Chart Card, then we recommend leaving the date range on the Item undefined or identical to the Card. This will help prevent confusion when moving between the Chart Card and the Chart Item.
What happens to the Chart when the date range is limited?
- The data will be unaffected.
- The Chart will only display data for dates within the specified range by default.
- Chart thumbnails — the image of the Chart shown on lists in the Detail View or which can be added to text areas — will reflect the date range.
- "Show All Dates" will appear near the Chart's legend. Click Show All Dates and the Chart will show data for every date and "Show All Dates" will be replaced with "Show Date Range."
Click Show Date Range and the Chart will once again only show data for the dates within the specified range.

Who can edit a Chart?
Only the following people can edit a Chart's Details or its data:
- Anyone on the Chart's Team except for Followers or Participants.
- Anyone with the “Edit” permission for Items in the Chart's Location(s).
![]() For more information on Team Roles (like Authors, Facilitators, Participants, and more!) check out this article.
For more information on Team Roles (like Authors, Facilitators, Participants, and more!) check out this article.
Set a date range
To set a Chart's date range, open the Chart with which you want to work, then:
- Select the ellipsis icon at the top right of the Chart Panel.
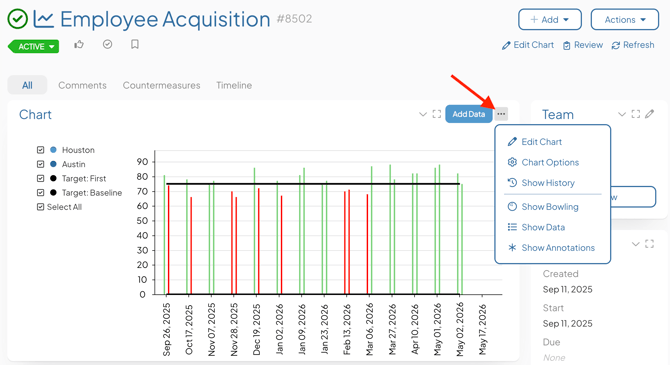
![]() If you need to build out your Chart in its entirety, check out the articles for your type of Chart: Threshold, Control Limit, Bowling, Bar/Line, or Pareto. If your Chart is already built and you just need to work with the advanced options, proceed.
If you need to build out your Chart in its entirety, check out the articles for your type of Chart: Threshold, Control Limit, Bowling, Bar/Line, or Pareto. If your Chart is already built and you just need to work with the advanced options, proceed.
- Select Chart Options in the drop-down menu. The "Chart Options" window will open.
- Locate the Visible Date Range section. When the date range is specified, data will not be shown for dates before the "Starting" date or for dates after the "Ending" date. Leave a field blank if you don't want to limit data in that direction.
- Starting: Expand the drop-down to choose the point at which the date range should begin.
Choose between several rolling dates (e.g. “Past 24 hours," "Past 12 months," etc.), “Now,” or click Specific Date to enter the exact date at which the range should begin. - Ending: Expand the drop-down to choose the point at which the date range should end.
Choose between several rolling dates (e.g. “Next 24 hours," "Next 12 months," etc.), “Now,” or click Specific Date to enter the exact date at which the range should end.
- Starting: Expand the drop-down to choose the point at which the date range should begin.
- Click Save to save your changes and return to the Edit Data window.
- Locate the Visible Date Range section. When the date range is specified, data will not be shown for dates before the "Starting" date or for dates after the "Ending" date. Leave a field blank if you don't want to limit data in that direction.
- Click Save on the Edit Data window to update the Chart.