![]() Warning: Your organization must have Charts enabled on at least one Template to perform the actions on this support page. Contact your Customer Success Manager if you'd like to start using Charts.
Warning: Your organization must have Charts enabled on at least one Template to perform the actions on this support page. Contact your Customer Success Manager if you'd like to start using Charts.
Threshold and Bowling Charts both compare your actual data to a series of thresholds or targets, respectively. By adding a Goal (and its visualizer) to these Charts, you can make it easier to quickly check-in and, with a glance, see the progress being made.
The Goal is calculated with the equation (Data - Baseline) / (Target - Baseline), in which:
- The Baseline is the first data point on the "Baseline Threshold" or "Baseline Target" series. If there is no such series, the first data point on the Data series associated with the Threshold or Bowling series will be used instead.
- The Data is the last data point on the Data series associated with the Threshold or Bowling series.
- The Target is the last data point on the "First Threshold" or "First Target" series.
As the equation suggests, the Goal can only be added and calculated once the following parameters have been met:
- A Threshold or Bowling series has been added to the Chart.
- A data series has been added to the Chart and has been associated with the Threshold or Bowling series.
- At least two rows of data have been added to the Chart.
- Values have been added for the "First Threshold" or "First Target" series.
Once the Goal has been added to a Chart and has been calculated, a Goal Visualizer will be added to the Chart's work panel.

/Ofie/Ofie%20Profile%20Pic.png?width=50&height=50&name=Ofie%20Profile%20Pic.png) Still not seeing the Goal Visualizer? The Chart Template may be customized and require assistance from your Customer Success Manager to add the Goal Visualizer to the layout.
Still not seeing the Goal Visualizer? The Chart Template may be customized and require assistance from your Customer Success Manager to add the Goal Visualizer to the layout.
This Visualizer will include a percentage — the "score" indicating how close the data is to meeting the Goal — and a visual gauge, the color of which will match that of the last data point on the Data series.
Pro Tip: You can display a Chart Goal in an Item List. Simply add the Chart Goal column in List, Tree, or Gantt View.
Who can edit a Chart?
Only the following people can edit a Chart's Details or its data:
- Anyone on the Chart's Team except for Followers or Participants.
- Anyone with the “Edit” permission for Items in the Chart's Location(s).
![]() For more information on Team Roles (like Authors, Facilitators, Participants, and more!) check out this article.
For more information on Team Roles (like Authors, Facilitators, Participants, and more!) check out this article.
Add a Goal to a Chart
To add a Goal, open the Chart with which you want to work, then:
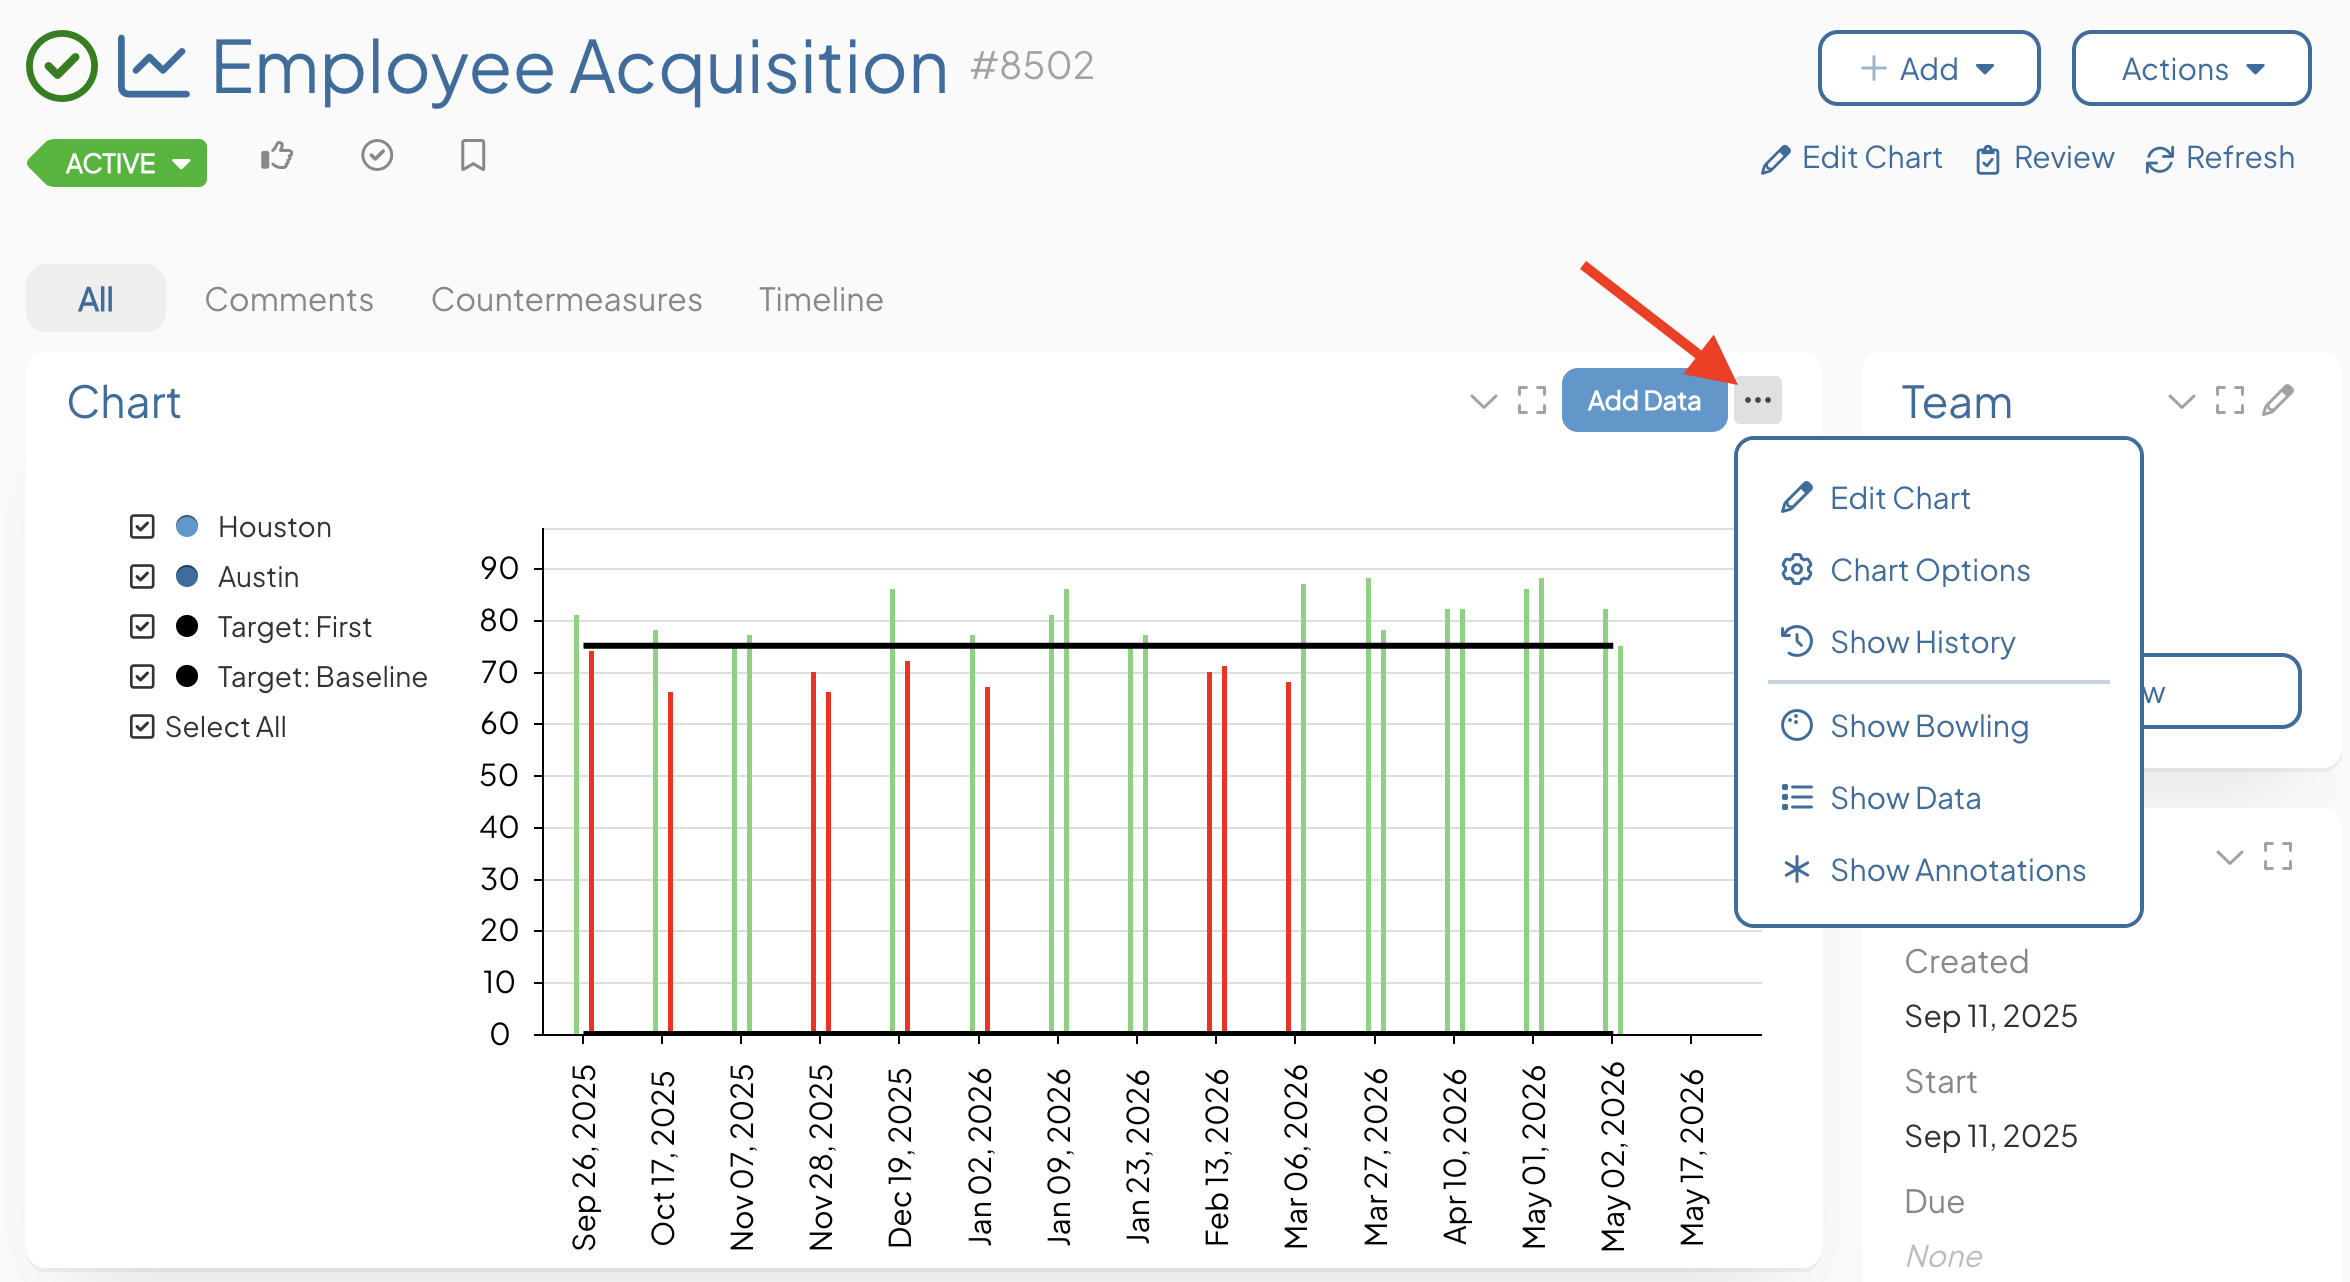
- Select the ellipsis icon at the top right of the Chart Panel.
![]() If you need to build out your Chart in its entirety, check out the articles for your type of Chart: Threshold or Bowling. If your Chart is already built and you just need to add a Goal, proceed.
If you need to build out your Chart in its entirety, check out the articles for your type of Chart: Threshold or Bowling. If your Chart is already built and you just need to add a Goal, proceed.
- Select Chart Options in the drop-down menu. The "Chart Options" window will open.
- Goal Series — This option will only appear for Threshold and Bowling Charts which have had at least one data series associated with a Threshold or Bowling series.
- Expand the drop-down to choose which data series should be used to calculate the goal percentage.
- Click Save to save your changes and return to the Edit Data window.
- Goal Series — This option will only appear for Threshold and Bowling Charts which have had at least one data series associated with a Threshold or Bowling series.
- Click Save on the Edit Data window to update the Chart. If all requirements have been met, the Goal will be calculated and the Visualizer will appear on the Chart's work panel.