Are you looking for a way to motivate people and measure the progress of your improvement efforts? Try setting Goals for your organization.
In KaiNexus, Goals help you set objectives for Locations in your Network. With Goals, you can encourage staff to submit more ideas, increase their engagement in the platform, or achieve a landmark amount of Impact.
Reports and Widgets help you display Goal progress on Boards, making it easy to keep leaders up-to-date on their Location's objectives.
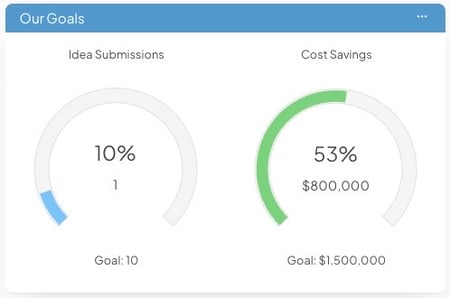
Image of a Widget Card displaying progress toward two Goals
Use Goals to:
- Track progress toward organizational ambitions
- Increase engagement and motivation of frontline staff
- Provide a tool for leaders to measure performance
- Set expectations on a Location by Location basis
Navigation
Now that you have a general understanding of Goals, keep reading to learn about:
- How Goals work, including:
How do Goals Work?
Goals allow you to set objectives for Network Locations. First, you decide which Goals you want to set for your organization. Then, you can give each Location within the organization a unique target, called a Goal Value, to strive toward.
/Ofie/Ofie%20Profile%20Pic.png?width=50&height=50&name=Ofie%20Profile%20Pic.png) Pro Tip: You must have the Goal Manager permission to create a Goal and assign Values to Network Locations.
Pro Tip: You must have the Goal Manager permission to create a Goal and assign Values to Network Locations.
For example, your organization might have a Goal to increase the number of Improvement submissions this year. Each Location within your Network can have a different number it is trying to reach. Next year, your organization could set a new Goal with a higher target.
There is no limit to the number of Goals you can create for your organization.
Who can create and edit Goals?
To create and edit Goals within your organization, you must have Goal Manager included in your System Role Permissions. If you have this Permission, be sure to check out our articles on creating, editing, and deleting Goals.
Types of Goals
There are five types of Goals in KaiNexus: Items Submitted, Items Completed, Impact, People Count, and People Percentage. Each helps you track a different kind of objective.
- Items Submitted Goals track the number of Items a Location submits during a defined time frame.
- Items Completed Goals track the number of Items a Location completes during a defined time frame.
- Impact Goals track the Impact a Location has achieved on its Items during a defined time frame.
- People Count Goals track the number of a Location's users that meet your customized criteria.
- People Percentage Goals track the percentage of a Location's users that meet your customized criteria.
Using these five basic Goal Types, your organization can create a wide variety of Goals. For example, you can have multiple Impact Goals for different Impact Types or several Item Goals for the various Templates utilized by your organization. If you are responsible for creating your organization's Goals, you can visit this article to learn more about customization options while making Goals.
Location & Below versus Location Only Goals
After a Goal has been created, each Location within the Network can have a Location & Below Goal and a Location Only Goal. These two types of Goal Values help you differentiate between a Location's individual objective and the objective a branch of your Network should complete collectively.
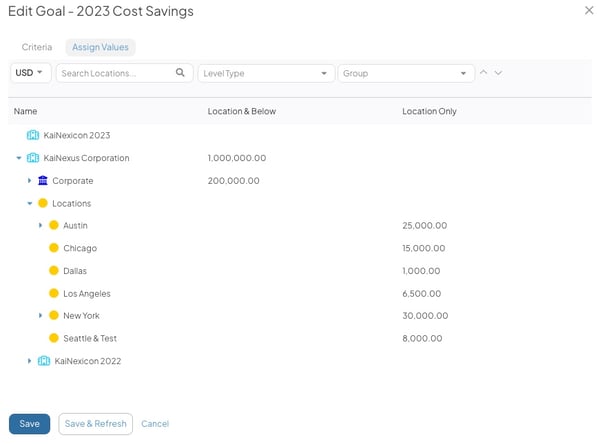 Image of the Edit Goal window where you can assign Goal Values for each Location. Only Users with the Goal Manager Permission can access this page.
- Location & Below Goals track data for the Location and all Locations nested beneath it. This means each nested Locations' contributions will be counted toward the assigned Goal Value.
- Location Only Goals track data for only the Location. This means the Location alone will be working toward its assigned Goal Value.
Goal Widgets
Use Goal Widgets to visualize progress toward Item, Impact, and People Goals. Goal Widgets are great to include on Huddle Boards, Location Boards, and Team Boards.
Goal Widgets are a gauge that visualizes a Location's progress toward its Goal. They also include the Goal Value, the current value, and the % to Goal. Which of these details appear on the Card can be customized when you edit the Widget.
/Goals/Goal%20Widget%20+%20Location%20Filter.jpeg?width=500&height=298&name=Goal%20Widget%20+%20Location%20Filter.jpeg)
This Widget shows Houston's Location & Below Cost Savings Goal ($100,000) and includes Houston, Engineering, and Information Technology Cost Savings ($60,000) during the time period set by the Goal.
Pro Tip: Click the gauge on the Goal Widget to open a List of Items contributing to the Goal.
Goal Widgets show a Goal for one Location at a time. You can decide which Location's Goal is displayed by:
- Using a Location Filter
- Using a Location Quick Filter, or
- Locking the Goal Widget to a single Location
Important: Check out this article to learn how to add a Goal Widget to a Board and customize the Widget settings.
Using the Location Filter with Goal Widgets
The Location Filter makes it easy to quickly switch between Goals for different Locations. Picking a Location on the Location Filter will populate the Goal progress for that Location.
While setting up a Goal Widget that works in conjunction with the Location Filter, there are a few things you should know:
- The Location & Below Checkbox on the Location Filter determines whether the Location Only or Location & Below Goal is displayed on the Widget.
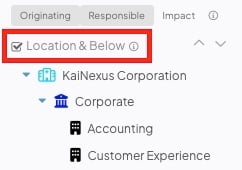
- If Location & Below on the Filter is not selected, the Widget will show the Location Only Goal. Contributions from Locations nested beneath each Location will not be included.
- If Location & Below on the Filter is selected, the Widget will show the Location & Below Goal. Contributions from Locations nested beneath each Location will be included.
- For Item and Impact Goals, the Location Types selected in the Location Filter must Location Type Filter must match the Location Types specified in the Goal criteria for the Goal Widget to populate data.
/Goals/Location%20Type%20Filter.jpeg?width=242&height=170&name=Location%20Type%20Filter.jpeg)
- For example, if Impact is selected in the Location Filter, only Widgets displaying Goals that track data for an Item's Impact Location will populate.
- If the Location Filter does not have a Location Type Filter, it defaults to Originating and Responsible, meaning the Widget will only show Goals that reference the Originating and Responsible Location.
- If your Goal Widget isn't displaying information, the reason may be that the Location Types for the Goal don't match the Location Types in the Board's Filter.
Using Location Quick Filters with Goal Widgets
Location Quick Filters provide another way to easily switch which Location's Goal is displayed on the Widget.
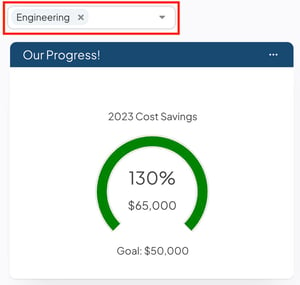 Example of a Goal Widget displaying the Engineering Location's Cost Savings Goal.
The difference between using the Location Filter and a Location Quick Filter to populate Goals on the Widget is that Location Quick Filters are more limited to which Goals they can display.
- Location Quick Filters can only populate Location & Below Goals on Widgets. If you want a Location Only Goal to appear on your Goal Widget, then you should use the full Location Filter instead.
- For Impact and Item Goals, Location Quick Filters can only populate Goals that reference the Item's Originating and Responsible Location. If you want a Goal with different Location Type criteria to show on the Widget, then you should use the full Location Filter instead.
Locking Goal Widgets to a Location
Important: If your Board does not have a Location Filter or Location Quick Filter, then you must lock the Goal Widget to a specific Location for the Widget to populate data.
If you want to add a Goal Widget to a Board without a Location Filter or Location Quick Filter, you can lock the Widget to a single Location.
Locking a Goal Widget to a Location means that it will always display that Location's Goal regardless of any Location Filters. It is also a great way to display Goals for multiple Locations on a Board simultaneously.
To learn how to lock a Goal Widget to a Location, check out this support article, and navigate to the section on Goal Widgets.
Goals on Reports
Pro Tip: People's Goals can only be visualized on Goal Widgets. Use Reports to visualize Item and Impact Goals.
There are several Reports you can use to visualize progress toward Item and Impact Goals.
Visualize Item Goals using Item Curve and Activity by Location Reports.
- Item Curve Reports display Item Goals for one Location at a time. The Location's Goal is marked with a gold line, helping you visualize progress toward Items Submitted and Items Completed Goals over time.

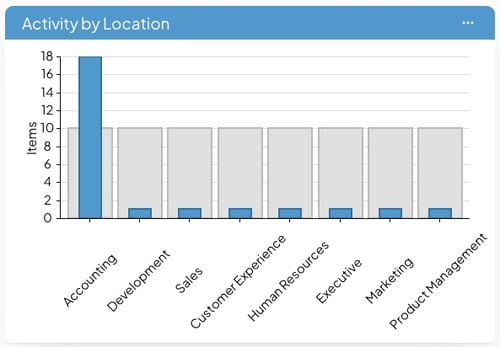
- Activity by Location Reports display Item Goals for multiple Locations simultaneously. You can visualize Goals in either List view or Graph view.
- List view provides columns displaying each Location's Goal and % to Goal.
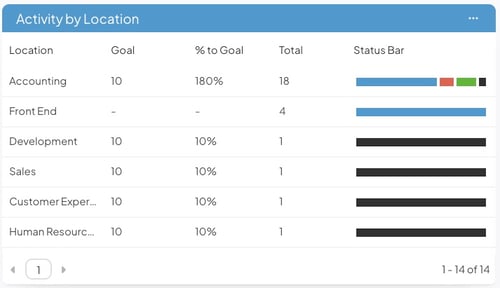
- Graph view displays gray Goal bars overlaid on the graph to visualize how close each Location is to achieving its goal.
- List view provides columns displaying each Location's Goal and % to Goal.
Visualize Impact Goals using Impact Over Time and Impact by Location Reports.
- Impact Over Time Reports display Impact Goals for one Location at a time. The Location's Goal is marked with a gold line, helping you visualize progress toward Impact Goals over time.

- Impact by Location Reports display Impact Goals for multiple Locations simultaneously. You can visualize Goals in either List view or Graph view.
-
- List view provides columns displaying each Location's Goal and % to Goal.
/Goals/Impact%20by%20Location%20Goals%20-%20List.jpeg?width=500&height=275&name=Impact%20by%20Location%20Goals%20-%20List.jpeg)
- Graph view displays gray Goal bars overlaid on the graph to visualize how close each Location is to achieving its Goal.
/Goals/Impact%20by%20Location%20Goals%20-%20Graph.jpeg?width=500&height=346&name=Impact%20by%20Location%20Goals%20-%20Graph.jpeg)
- The blue bars represent each Location's current value
- The gray bars represent each Location's Goal
- List view provides columns displaying each Location's Goal and % to Goal.
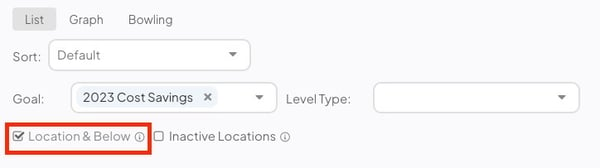
Locations can have two Goal Values for a single Item or Impact Goal: a Location Only Goal and a Location & Below Goal. Use the Location & Below checkbox to control which Goal is displayed on Reports.
- Impact by Location and Activity by Location Reports have a Location & Below checkbox on the Report controls. This checkbox determines which Goal Value is shown on the Report
 .
.
- If Location & Below is not selected, the Report will show Location Only Goals. Contributions from Locations nested beneath each Location will not be included.
- If Location & Below is selected, the Report will show the Location & Below Goals. Contributions from Locations nested beneath each Location will be included.
Pro Tip: Control which Locations are included on "by Location" Reports using the Location Filter.
- Impact Over Time and Item Curve Reports do not have the Location & Below checkbox on the Report controls. Instead, you will use the Location & Below checkbox on the Location Filter to determine which Goal Value is shown on the Report.
- If Location & Below is not selected, the Goal line will be equal to the Location Only Goal. Contributions from Locations nested beneath each Location will not be included in Report data.
- If Location & Below is selected, the Goal line will be equal to the Location & Below Goal Contributions from Locations nested beneath each Location will be included in Report data.
Pro Tip: If you have an Impact Over Time or Item Curve Report on a Board, then you must have a Location Filter to display Location Only Goals. Otherwise, the Location & Below Goal will always be displayed.
What's Next?
Now that you understand the basics of what Goals are and how to visualize them in KaiNexus, you can visit the following articles to learn more.