The Activity by Location Report lets you drill down into any level of your organization to find the areas that are actively improving their work and those which could use more coaching.
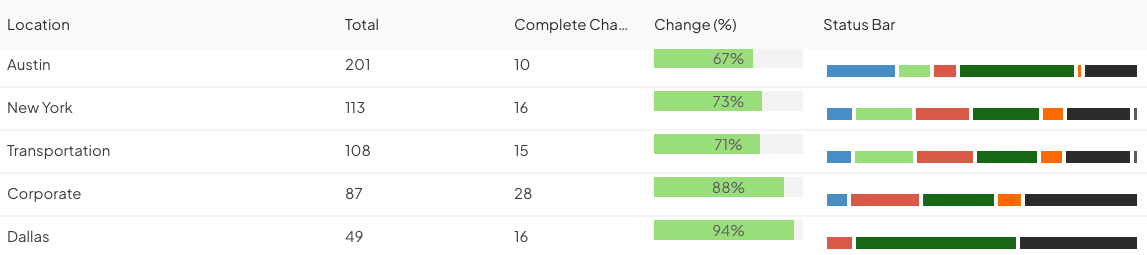
Example of an Activity by Location Report in List view. For each Location in the Report, you can see its total number of Items and information about those Items, including a Status Bar.
Who can access this Report?
Anyone with the "View Report Data" permission will be able to see this Report.
This Report can be accessed under the Activity section of the Reports page. It can also be added as a Card on a Board.
Working with the Report
- Understand the Report's views
- Use filters to control which data are referenced by the Report
- Show Goals on the Report
- See a list of Items referenced by the Report
- Share the Report
The views
This Report has four views. Click the name of the view you want to see to toggle between them.

- List: This view displays the total number of Items that originated from or were worked on by each Location, the number of those Items which resulted in a change, the percentage of those Items which resulted in a change, and a status bar showing the current status of each of those Items.

- Hover over a column's header and click the caret icon, then hover over Columns to add and remove columns from the list, or click Sort Ascending or Sort Descending to sort the list by that column in ascending or descending order.
- Tree: This view is similar to List, but it organizes the Locations by their hierarchy in the Network, providing a clearer picture of data flow throughout your organization.

- This view can only display up to 100 Locations.
- Hover over a column's header and click the caret icon, then hover over Columns to add and remove columns from the list.
- Sorting the Report by a particular column will have no effect; the Locations will always be ordered based on the Network structure.
/Ofie/Ofie%20Profile%20Pic.png?width=50&height=50&name=Ofie%20Profile%20Pic.png) Pro Tip: Try adding the People or Level Type column to provide more context on each Location's user count and positioning within your organization.
Pro Tip: Try adding the People or Level Type column to provide more context on each Location's user count and positioning within your organization.
- Graph: Displays the data as a bar graph. The color of the bars will match each Location's Level Type icon.

- Display as Bar: Expand the drop-down to select the dataset that should be represented on the graph. By default, this Report will show the total number of Items per Location.
- Sort: Expand the drop-down to select by which criterion this dataset should be ordered.
- Max: Enter the number of data points that should be represented on this graph. By default, this Report will show 15 data points, but it can be configured to show 1-53.
- Show Values: When enabled, the value of each data point will be displayed on the graph.
Pro Tip: Want more control over Graph view? Customize the Report's Graph Options to rename the X- and Y-axes, adjust label angles or truncation, and make other display tweaks.
- Over Time: This view displays Item count data by Location across various time frames. Based on your selected reference date, the table will display the number of Items that were created, started, due, or completed within each time frame.

- Column Totals: Select this checkbox to include a total for each column. This will display all Locations' combined Item count for each time frame.
- Row Totals: Select this checkbox to include a total for each Location. This will display the Location's total Item count for the report's entire date range.
Regardless of the view, you should look for:
- Locations that are contributing lots of Items and driving your key metrics. The employees and leaders there deserve recognition and reward!
- Locations that have a lot of new or overdue Items. This may be indicative of a bottleneck.
The filters
Any relevant filters in use on the main Reports screen will be automatically applied to this Report but can still be configured as needed.
- There are two date-based drop-downs. First is the "Reference Date" drop-down and second is the "Range" drop-down.

- Reference Date: Expand the drop-down to choose which type of date should be referenced by the Report. For example, select "Created in" if you want the Report to reference only those Items that were created in the specified date range.
-
- Range: Expand the drop-down to choose the range of dates that should be included in the Report.
- All Time removes any date range parameters.
- Custom allows you to enter any date range you want.
- Past shows you a rolling date range that counts back from the current calendar date.
- Current shows you data for the current week, month, quarter, or year.
- Last shows you data for the previous week, month, quarter, year, or multi-year period.
- Range: Expand the drop-down to choose the range of dates that should be included in the Report.
Pro Tip: The Last YTD option helps you set a date range matching the current year-to-date period but for the previous year instead. For example, if it is March 15th, 2024, and you select Last YTD, your Report will cover data from January 1st, 2023, to March 15th, 2023. This logic is also true for the Last MTD and QTD options.
-
- Interval: This option will be available when your Report is in Over Time view. Use this drop-down to select how the report's time frames are divided—by month, quarter, or year. For example, choosing "Month" will display data for each month within your selected date range.
- Workflow: Expand the drop-down to choose which workflows should be included in the Report.
- Template: Expand the drop-down to choose which Templates should be included in the Report.
- Select Originating, Responsible, or Impact to decide whether the Report should reference Items from the Originating, Responsible, or Impact Location.
- Originating and Responsible will be the default selection.
- If Impact is selected, both Originating and Responsible will be toggled off.
-
- If no Location is selected in the Location Picker or Item Filter, the Originating, Responsible, and Impact toggles will not affect Report data.
- Click the filter icon, and the Item Filter window will open.

- Update the item filters to control which Items are included in the Report's metrics.
- Click Save.
- Click the Locations panel on the left side of the Report to expand it.
- Filter the Report by Location and only Items tied to the selected Locations will be included in the Report.
- Level Type: Expand the drop-down to choose the types of Locations that should be listed in the Report.
- The Location & Below checkbox: When selected, each Location on the Report will include data for itself and all Locations nested beneath it. Use this checkbox when you want to see data "roll-up" to higher-level Locations.
Show Goals on the Report
There will be a Goal drop-down if your organization has at least one Item Goal created. The drop-down will contain each of your organization's Items Submitted and Items Completed Goals. If your organization does not have any Item Goals, this drop-down will be absent.

Pro Tip: Check out this article learn more about how Goals work and different ways you can visualize them.
When you make a selection in the Goal drop-down, any existing filters applied to the Report are cleared and replaced with filters matching the criteria of your selected Goal. This ensures the Report displays all Items contributing to the Goal.

Example of what the Report controls look like after a Goal has been selected. The Quick Filters are hidden.
Warning: You can continue to tweak Report Filters after the Goal has been selected, but it might result in the Goal no longer being shown in the Report.
Use List, Tree, or Graph view to Report on Goals.
- List and Tree view provide columns displaying the Goal and % to Goal for each Location. These columns are added automatically when you select a Goal.
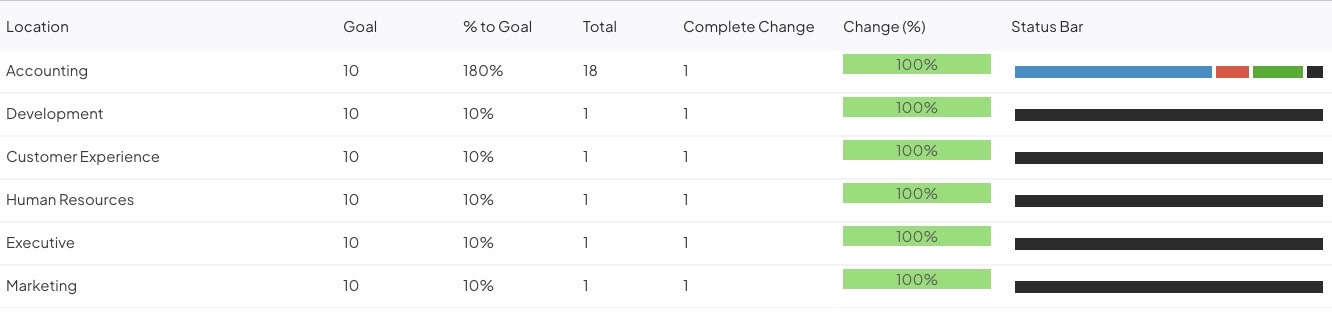
- The Goal column displays the Location’s Goal Value.
- The % to Goal column displays the Location’s progress toward its Goal expressed as a percent of the Goal.
- If a Location does not have a Goal set, the Goal and % to Goal columns will show “-”.
- Graph view displays gray Goal bars overlaid on the graph to visualize how close each Location is to its Goal.

- The blue bars represent each Location's current progress toward its Goal. Hover over the blue bar to view a tooltip with the Impact total for that Location.
- The gray bars represent each Location's Goal. Hover over the gray bar to view a tooltip with the Goal Value for that Location.
The Location & Below checkbox on the Report edit menu determines which Goal is displayed.

- If Location & Below is not selected, the Report will show Location Only Goals. Contributions from Locations nested beneath each Location will not be included.
- If Location & Below is selected, the Report will show the Location & Below Goals. Contributions from Locations nested beneath each Location will be included.
Pro Tip: Control which Locations are included on the Report using the Location Filter.
See a list of Items referenced by the Report
When in List, Tree, or Over Time view:
- Click a Location's Total, Complete Change, or Change (%) values to see a list of all their Items contributing to that metric.
- Hover over a segment of a Location's status bar to open a tooltip that lists the number of Items it includes.
- Click a segment of a Location's status bar to open a list of all Items that it includes.
When in the Graph view:
- Hover over a bar or bar segment to open a tooltip that lists its exact value.
- Click a bar or bar segment to open a list of all Items that it includes.
Share the Report
To share the Report, select the ellipsis icon. In the resulting drop-down menu, you can export the Report as a PDF, download it as an XLSX file, or copy it to a Board.

- Select Print/Save PDF to export the Report as a PDF. This option is only available in List and Graph view.
In the Print window:
- Page Size: Expand the drop-down to choose your preferred page size.
- Scale: Expand the drop-down to choose the scale percentage. This allows you to fit more content on a single page. For example, selecting 50% doubles the amount of content you can fit on one page. Make sure to select "Fit to page" in your browser's print settings.
- Click either Portrait or Landscape to choose the PDF's orientation.
- Click Print.
The Location of the Report will appear on the exported PDF beneath the Report title.
- Select Save XLSX to export the Report as a spreadsheet document. This option is only available in the List and Over Time view.
- Select Copy to Board to add the Report as a Card on a Board.
- In the resulting window, select a Board. All Boards that you have permission to edit will appear as options.
- Select Copy to add the Report to your selected Board. All filters and columns included on the Report will be carried over to the Card.
- The Report Card will appear at the Board's top left corner.