The Impact Over Time Report shows you the Impact of Items over time, helping you measure trends and track progress toward your objectives.
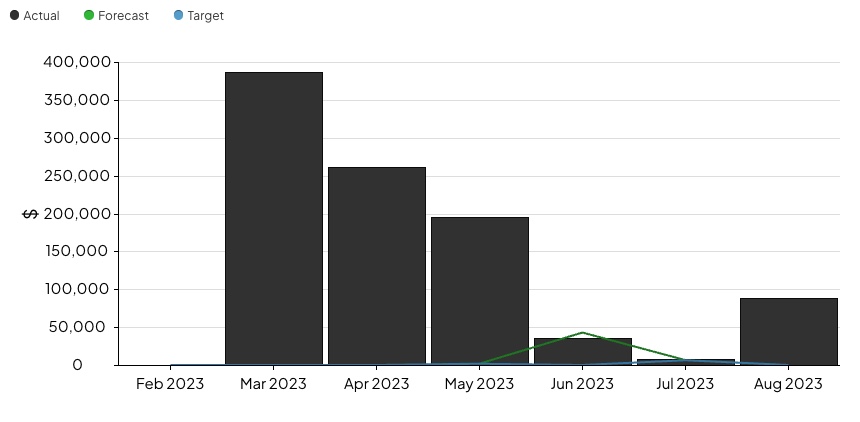
Example of the Impact Over Time Report. The black bars represent Actual Impact for each time interval. If you have the Advanced ROI Module, Forecast and Target Impact is visualized as lines on the Report.
Who can access this Report?
Anyone with the "View Report Data" and "View Impact" permissions will be able to see this Report.
This Report can be accessed under the Impact section of the Reports page. It can also be:
- Added as a Card on a Board
- Generated from an Item
Working with the Report
- Understand the Report's views
- Use filters to control which data are referenced by the Report
- Show Goals on the Report
- See a list of Items referenced by the Report
- Share the Report
- Impact Over Time Report Cards
The views
This Report has two views. Click the name of the view you want to see to toggle between them.
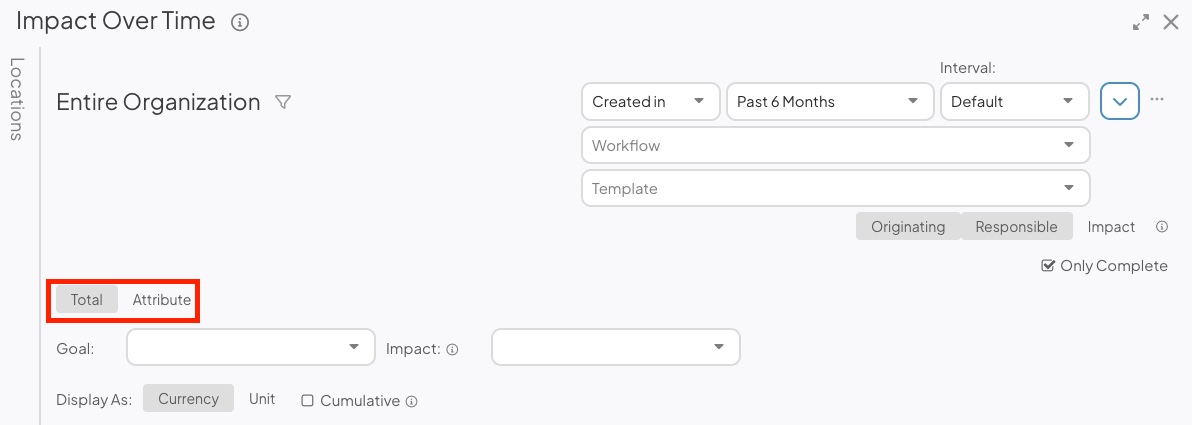
- Total: Shows the total impact of Items over time.
- If your organization is not using the Advanced ROI module, this view will only include a bar graph that represents the financial impact of the referenced Items.
- If your organization is using the Advanced ROI module, this Report's graph will include:
- A bar series that pulls data from the referenced Items' Actual Resolutions
- A line series that pulls data from the referenced Items' Forecast Resolutions
- A line series that pulls data from the referenced Items' Target Resolutions
- If the Location(s) included in the Report have a monthly goal in the set date frame, a line series that represents that goal.
- Click any of those series in the graph's legend to toggle it on or off.
- Attribute: Shows the total impact of Items that are tagged with a value from the selected Attribute over time.
- No data will be shown on this view until you select an Attribute from the Attribute drop-down.
- When you select an Attribute, the Value drop-down will appear. Use it to specify which values to include in the Report. Only Impacts for Items with the selected value will be included in the data. If left blank, all of the Attribute's values will be included.
- You can also click any of the Attribute Values in the report's legend to toggle them on or off.
- Each Attribute Value will be a segment in the report's bars. The color of the bar segments correspond to the icon color of each Attribute Value, which is configured on the Attribute administration page.
- If the selected Attribute has multiple associations, an additional Attribute Type drop-down will appear. Use this dropdown to specify whether you want to reference Items where the Attribute is used in the Item Work Panel, Impact, or AdHoc Field.
The filters
Any relevant filters in use on the main Reports screen will be automatically applied to this Report but can still be configured as needed.
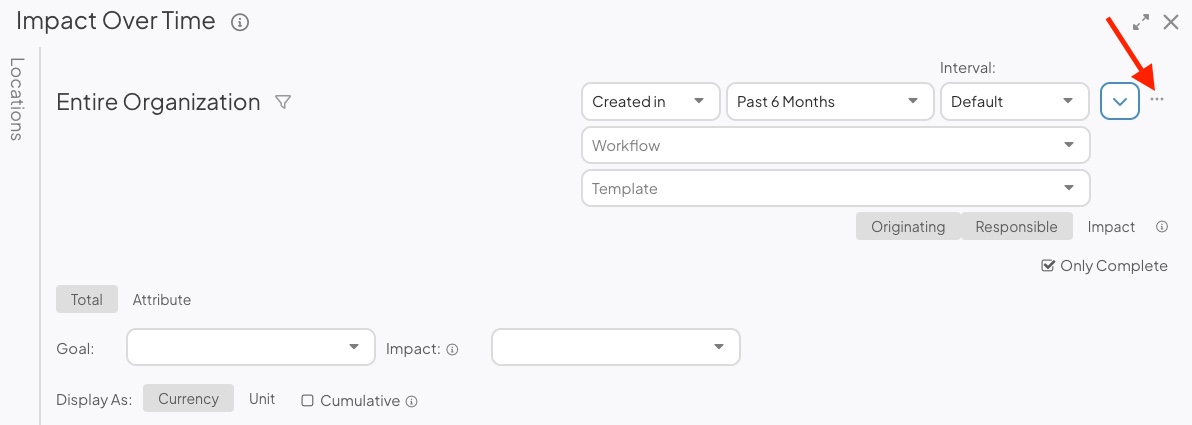
- There are three date-based drop-downs. From left to right, there's the "Reference Date" drop-down, the "Range" drop-down, and the "Interval" drop-down.
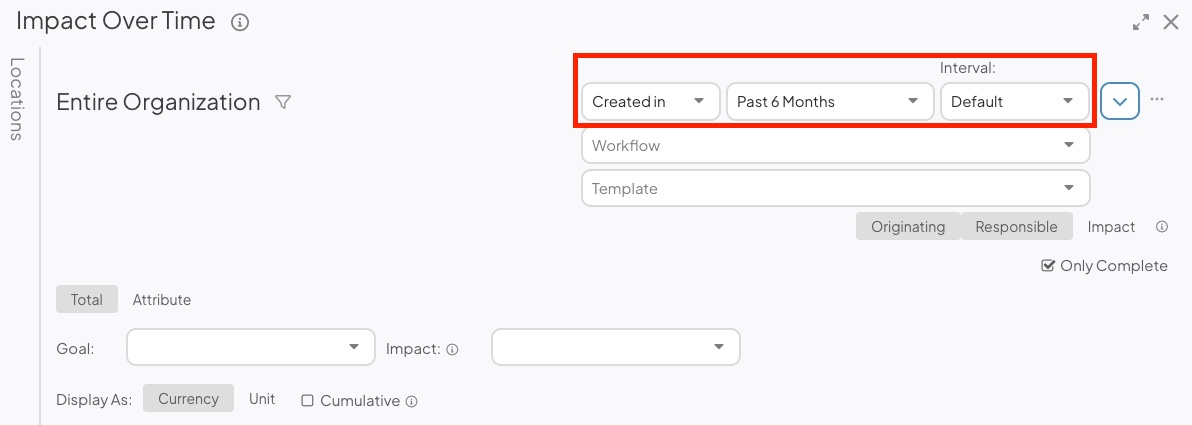
- Reference Date: Expand the drop-down to choose which type of date should be referenced by the Report. For example, select "Created in" if you want the Report to reference only those Items that were created in the specified date range.
- Range: Expand the drop-down to choose the range of dates that should be included in the Report.
- All Time removes any date range parameters.
- Custom allows you to enter any date range you want.
- Past shows you a rolling date range that counts back from the current calendar date.
- Current shows you data for the current week, month, quarter, or year.
- Last shows you data for the previous week, month, quarter, year, or multi-year period.
/Ofie/Ofie%20Profile%20Pic.png?width=50&height=50&name=Ofie%20Profile%20Pic.png) Pro Tip: The Last YTD option helps you set a date range matching the current year-to-date period but for the previous year instead. For example, if it is March 15th, 2024, and you select Last YTD, your Report will cover data from January 1st, 2023, to March 15th, 2023. This logic is also true for the Last MTD and QTD options.
Pro Tip: The Last YTD option helps you set a date range matching the current year-to-date period but for the previous year instead. For example, if it is March 15th, 2024, and you select Last YTD, your Report will cover data from January 1st, 2023, to March 15th, 2023. This logic is also true for the Last MTD and QTD options.
-
- Interval: Expand the drop-down to choose the interval, or "buckets," by which the Report should be organized.
- Workflow: Expand the drop-down to choose which workflows should be included in the Report.
- Template: Expand the drop-down to choose which Templates should be included in the Report.
-
Select Originating, Responsible, or Impact to decide whether the Report should reference Items from the Originating, Responsible, or Impact Location.
- By default, both Originating and Responsible will be selected.
- If Impact is selected, both Originating and Responsible will be toggled off.
- If no Location is selected in the Location Picker or Item Filter, the Originating, Responsible, and Impact toggles will not affect Report data.
- The Only Complete checkbox: When enabled, this Report will only include data from completed Items; when disabled, it includes data from any Item that has a Resolution saved, regardless of status.
- Currency: Two fields control which currencies are included in the Report and whether they are converted to another currency. Multi-currency and currency conversion is only available if your organization has the Advanced ROI Module.
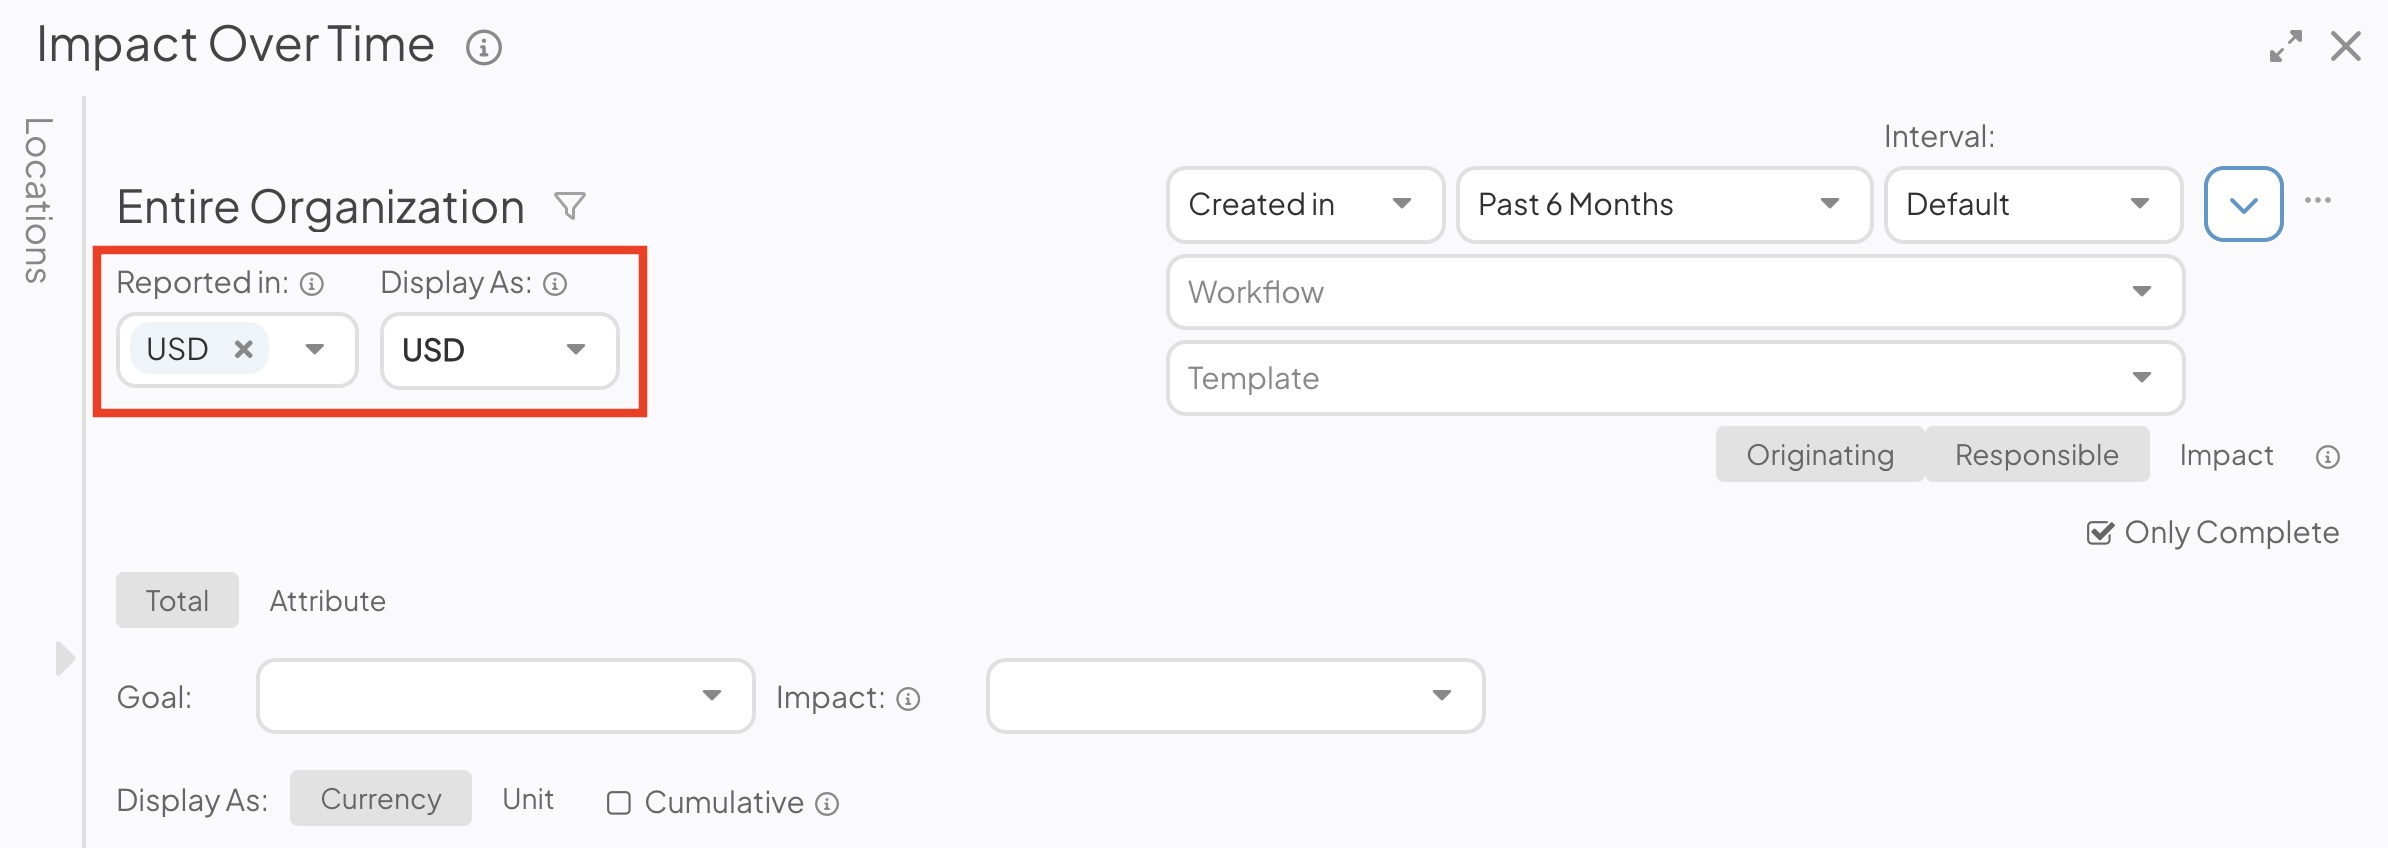
- Reported in (appears only if your organization uses multiple currencies): Select which Impacts are included in the Report based on their currency. The Report will display only Impacts originally logged in that currency.
- If your organization does not use currency conversion, this field will be single-select, and you can only display Impacts in one currency at a time.
- If your organization uses currency conversion, this field will be multi-select. If you want to consider all Impacts in your organization regardless of their currency, then select Any Currency.
- Reported in (appears only if your organization uses multiple currencies): Select which Impacts are included in the Report based on their currency. The Report will display only Impacts originally logged in that currency.
-
- Display As: (appears only if your organization uses currency conversion): Select which currency the Report displays. Any currencies selected in the "Reported in" field will be converted to this currency and summated in the Report data.
- This drop-down is single-select. The Report can only display data in one currency at a time.
- Display As: (appears only if your organization uses currency conversion): Select which currency the Report displays. Any currencies selected in the "Reported in" field will be converted to this currency and summated in the Report data.
Pro Tip: The system will use your selection in the Reference Date drop-down when determining which Exchange Rate to use for the currency conversion. For example, if you select "Realized In," the Impacts are converted using the Exchange Rate active on their Realized Date. If you select "Created In," Impacts are converted using the Exchange Rate active during their Item's Create Date. Check out our article about setting your organization's Exchange Rates to view current and historical Exchange Rates configured by your organization.
- Click the filter icon and the Item Filter window will open.
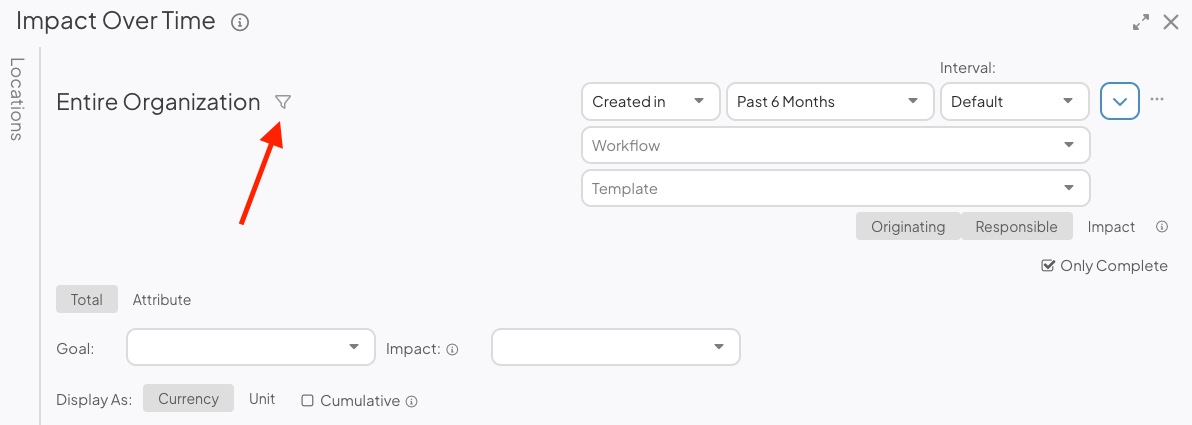
- Update the item filters to control which Items are included in the Report's metrics.
- Click Save.
- Click the Locations panel on the left side of the Report to expand it.
- Filter the Report by Location and only Items tied to the selected Locations will be included in the Report.
- Impact: Expand the drop-down to choose the Impact(s) which should be shown on the Report.
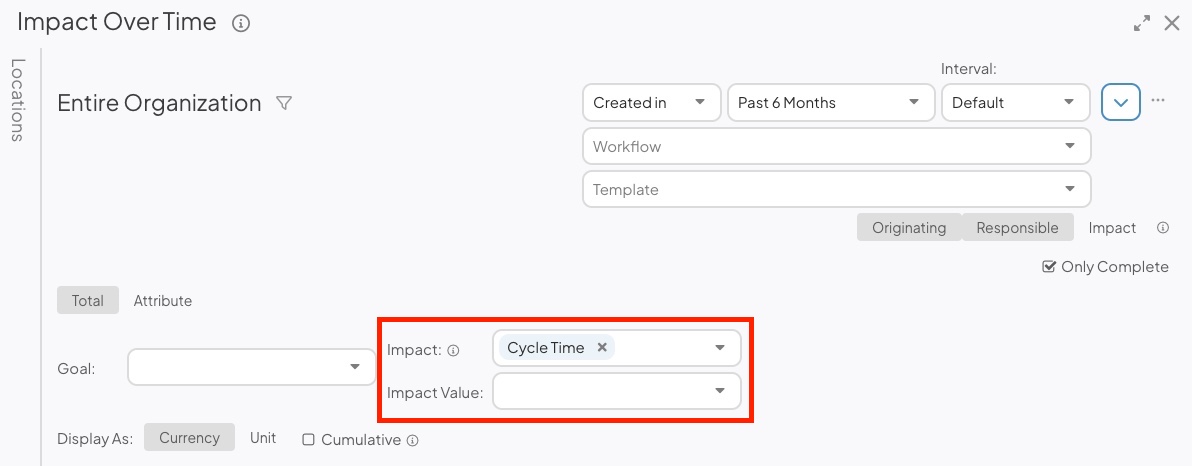
- When this drop-down is empty, all Impact Types, except for Qualitative Impacts, will be included in the Report.
- If All Financial Impact is selected, all Impacts in the Cost Avoidance, Cost Savings, Revenue Generation, Product, and Resource Impact Categories will be included.
- If All Soft Savings is selected, all Impacts in the Cycle Time, Environmental Impact, Lead Time, Takt Time, Time Savings, and Waste Impact Categories will be included.
- If you select an Impact that has Impact Values, which are additional classifications of the Impact, an additional drop-down will appear.
- Impact Value: Expand the drop-down to choose which Impact Values should be included in the Report.
![]() Pro Tip: If you choose the impact(s) via the Item filter instead, the Report will only include data from Items that have those Impacts but will still show all Impact types.
Pro Tip: If you choose the impact(s) via the Item filter instead, the Report will only include data from Items that have those Impacts but will still show all Impact types.
- Investment: Expand this drop-down to choose the Investments that should be displayed on this report.

- This drop-down will only appear if your organization has the Advanced ROI Module and at least one type of Investment.
- When you select an Investment, gray Investment bars will appear behind the Impact bars, helping you evaluate the return on your investment for each time period. Selecting multiple Investments will aggregate them together.

- Attribute: Expand the drop-down to choose the Attribute(s) the Report should reference. This option is only available when in the Attribute view.
- If the selected Attribute has multiple associations, an additional Attribute Type drop-down will appear. Use this dropdown to specify whether you want to reference Items where the Attribute is used in the Item Work Panel, Impact, or AdHoc Field.
- Use the Display As toggles to determine whether Impact data is displayed in Currency or Units. This selection is important when the Impacts you have selected can be reported both ways. For example, Time Savings can be reported in hours (Units) or the soft savings associated with those hours (Currency).
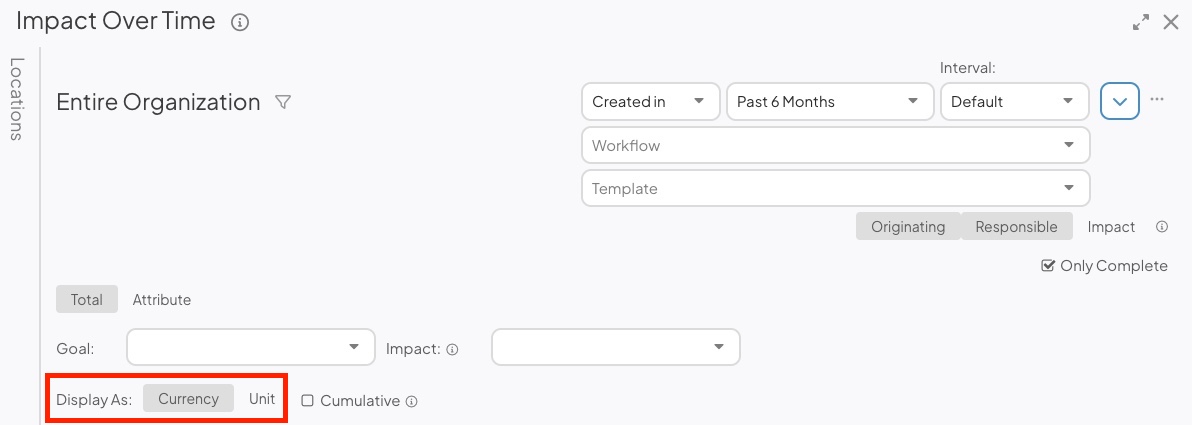
- Currency: When selected, Impact data will be displayed in monetary amounts.
- Unit: When selected, Impact data will be displayed in units.
- The Cumulative checkbox: When enabled, this Report will display the total impact (calculated by adding the impact of all preceding values over the selected time period).
Show Goals on the Report
There will be a Goal drop-down if your organization has at least one Impact Goal created. The dropdown contains each of your organization’s Impact Goals. If your organization does not have any Impact Goals, this dropdown will be absent.
Pro Tip: Check out this article learn more about how Goals work and different ways you can visualize them.
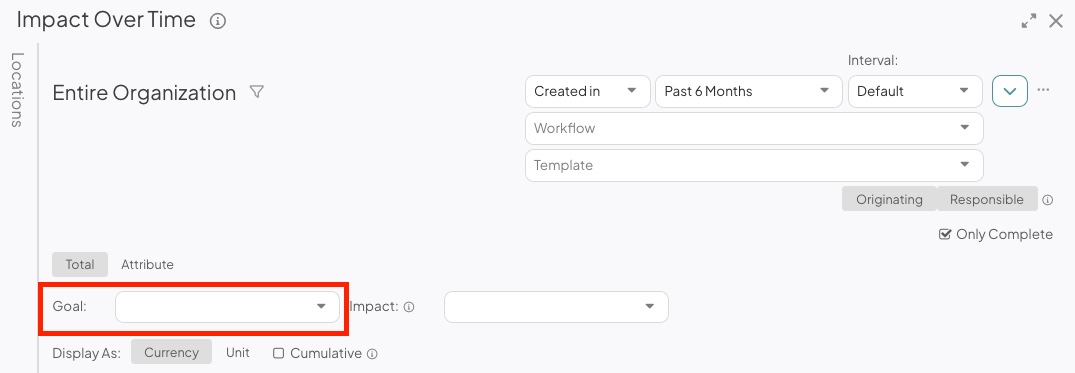
When you make a selection in the Goal dropdown, any existing Filters being applied to the Report are cleared and replaced with Filters matching the criteria of your selected Goal. This ensures the Report displays all Impacts contributing to the Goal.
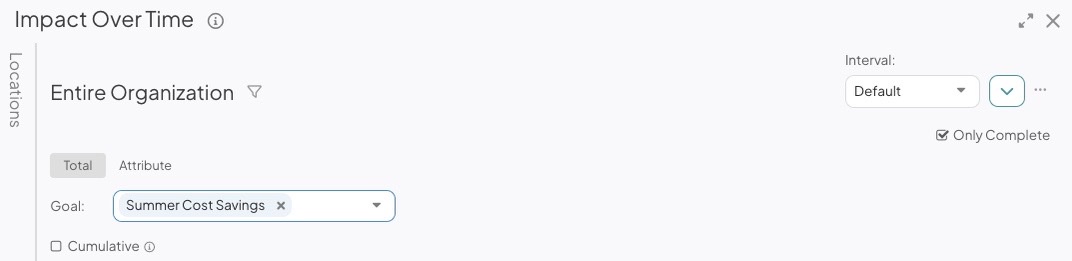
Example of what the Report controls look like after a Goal has been selected
Warning: You can continue to tweak Report Filters after the Goal has been selected, but it might result in the Goal no longer being shown on the Report.
You can use either Total or Attribute view while visualizing a Goal on the Impact Over Time Report. However, if you use Attribute view, any Items that meet the criteria of your Impact Goal but do not have the selected Attribute will not be included in the Report.
In both views, selecting a Goal adds a gold Goal line to the Report.

- When the Cumulative checkbox is selected, the gold bar will be diagonal, helping you visualize progress toward your Goal over time. If unselected, the gold bar will be horizontal.
- You must select a Location in the Location Filter for the Goal line to appear on the Report. The Goal line will change position based on the Location's Goal.
It is possible for each Location to have two Goal Values for a single Impact Goal: a Location Only Goal and a Location & Below Goal. Which Goal is displayed depends on the Location & Below checkbox on the Location Filter.
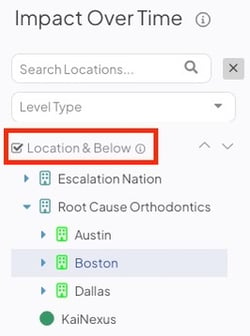
- If Location & Below is not selected, the Report will show Location Only Goals. Contributions from Locations nested beneath each Location will not be included in Report data.
- If Location & Below is selected, the Report will show the Location & Below Goals. Contributions from Locations nested beneath each Location will be included in Report data.
See a list of Items referenced by the Report
There are several lists that can be generated by this Report:
- Click any point on any of the Total view's bars or lines (except for the Goal line) to open a list of Items contributing to that metric.
- Click any of the stacked bars on the Attribute view to open a list of Items contributing to that metric.
The Item List will include a column that displays each Item's individual contribution to the metric.
Share the Report
To share the Report, select the ellipsis icon. In the resulting drop-down menu, you can export the Report as a PDF or copy it to a Board.
- Select Print/Save PDF to export the Report as a PDF. The "Print" window will open.
- Page Size: Expand the drop-down to choose your preferred page size.
- Scale: Expand the drop-down to choose the scale percentage. This allows you to fit more content on a single page. For example, selecting 50% doubles the amount of content you can fit on one page. Make sure to select "Fit to page" in your browser's print settings.
- Click either Portrait or Landscape to choose the PDF's orientation.
- Click Print.
The Location of the Report will appear on the exported PDF beneath the Report title.
- Select Copy to Board to add the Report as a Card on a Board.
- In the resulting window, select a Board. All Boards that you have permission to edit will appear as options.
- Select Copy to add the Report to your selected Board. All filters and columns included on the Report will be carried over to the Card.
- The Report Card will appear at the Board's top left corner.