When reporting on Impact data in KaiNexus, it's important to understand the key terminology. This ensures you can accurately display and analyze the data that matters most to you.
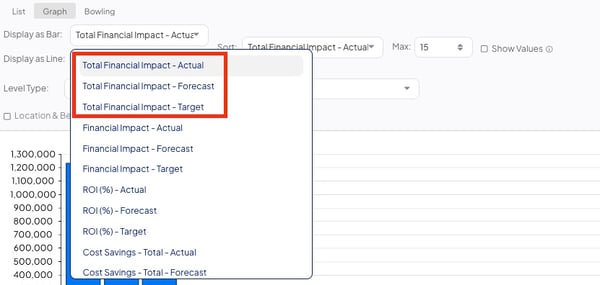
For example, Impact Reports in Graph view let you pick which data to display as lines or bars. There are a lot of options to choose from, especially for organizations with the Advanced ROI module. This allows you to be very detailed with what information you want to visualize, but it can be overwhelming if you don't know exactly what you are looking for.
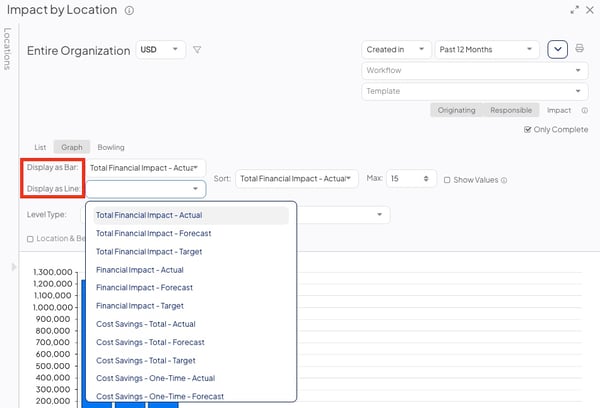
Example of "Display" dropdown selections in the Graph view of an Impact Report
In addition to Reports, you will also see Impact terms such as "Recurring", "Total Financial Impact" and "ROI%" appear in Widgets, Custom Impact Columns, and Item Filters.
This article will cover three key components of Impact data that you should know to build accurate reports:
/Ofie/Ofie%20Profile%20Pic.png?width=50&height=50&name=Ofie%20Profile%20Pic.png) Pro Tip: Do you have an Impact Report in List view? You will see the terms this article discusses in the column customization options. Check out this article for information on how to add, edit, and delete columns on Cards.
Pro Tip: Do you have an Impact Report in List view? You will see the terms this article discusses in the column customization options. Check out this article for information on how to add, edit, and delete columns on Cards.
Impact Categories
The first thing you should decide when selecting what Impact data to display is the Impact Category. Your Impact Category will determine which Impact Types are included in the data.
Pro Tip: Every Impact belongs to an Impact Category. Check out this article to learn more about Impacts.
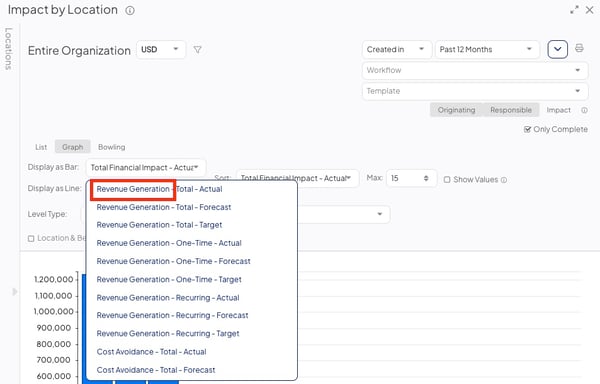
Example of an Impact Category in the Display dropdown. The Impact Category is always written first.
Warning: If you don't see a certain Impact Category in the dropdown, it is because your organization does not have an Impact belonging to that category.
There are Qualitative Impact Categories, Quantitative Impact Categories, and preset options.
Qualitative Impact Categories
Qualitative Impacts are not expressed in numerical units. They are conceptual Impacts that refer to improved experiences, settings, or circumstances.
The five qualitative Impact Categories are:
- Quality
- Safety
- Satisfaction
- Environment
- Health
When you select one of these categories, you will see data for all Impacts in the category.
Quantitative Impact Categories
Quantitative Impacts are expressed in numerical values, such as currency, hours, or units. Most organizations primarily use Financial Impacts, which are a subcategory of Quantitative Impacts.
Financial Impacts are exclusively measured in currency. Your organization will have Financial Impacts organized beneath the following three Impact Categories:
- Revenue Generation
- Cost Savings
- Cost Avoidance
Some organizations choose to use Quantitative Impacts that are not primarily measured in currency. Instead, they are measured in a different kind of unit, such as hours. These Impact Categories include:
- Time Savings
- Product
- Resource
- Cycle Time
- Lead Time
- Takt Time
- Waste
- Environmental Impact
Pro Tip: Quantitative Impacts logged in non-currency units use Impact Values. For example, in Time Savings People, the Impact Values might be roles like engineers, IT staff, or nurses—the specific types of people whose time was saved.
Impact Values let you pinpoint exactly who, what, or which process was affected. You can then assign a monetary rate to each value, making it possible to estimate savings in dollars.

In this example, the "people" represent Impact Values. Users report which role benefited from the improvement and how many individuals in that role were affected. Based on each role's hourly rate, the system calculates a savings value.
Users with the Quality Administrator System Role Permission can edit the monetary value per unit of Quantitative Impacts in the Admin Section.
When visualizing Impact data for these types of Quantitative Impacts, you can view data in either units or the monetary value of the Impact.
- Currency: A dollar (or other currency) amount will be calculated based on the rate of the Impact Value.
- Values/Hours: The total units of Impact will be displayed.
Example: An organization with the Advanced ROI module that is tracking Cycle Time for their production process would see the Display options below.
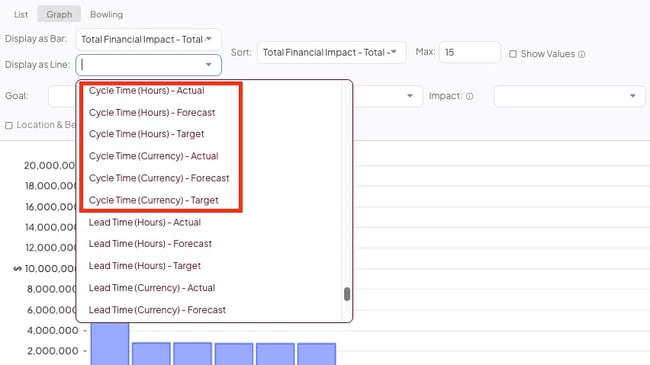
Assuming their production process has a cost of $1,000 per hour, and there have been 20 hours of Cycle Time saved, then selecting Cycle Time (Hours) - Actual would show 20 hours on the graph, and selecting Cycle Time (Currency) - Actual would show $20,000 on the graph.
Preset Impact options
In addition to visualizing data for specific Impact Categories, you can also use one of KaiNexus' present options to report on. The following options provide unique insights that you might not be able to display using Impact Categories alone.
- Financial Impact: The monetary value of all Financial (Cost Savings, Revenue Generation, and Cost Avoidance), Resource, and Product Impacts will be displayed. It does NOT include soft savings Impacts such as Waste, Environmental Impact, Time Savings, Cycle Time, Takt Time, or Lead Time.
- Total Financial Impact: The monetary value of all Quantitative Impacts will be displayed. This includes Cost Savings, Revenue Generation, Cost Avoidance, Resource, Product, Waste, Environmental Impact, Time Savings, Cycle Time, Takt Time, and Lead Time.
- Note: Non-financial Quantitative Impacts must have a rate greater than $0 per unit in order for their monetary value to pull into Total Financial Impact data.
- ROI%: The percent return on Investment will be displayed. ROI% will take the difference between the Investment (including Financial Investments and Resource Investments) and the Financial Impact (described in the first bullet point of this list) and express it as a percentage of the Investment.
- Completed: The number of Completed Items meeting your criteria will be displayed.
- Change%: The percent of Items meeting your criteria that have resulted in change will be displayed.
Warning: Your organization must have the Advanced ROI Module to report on ROI%.
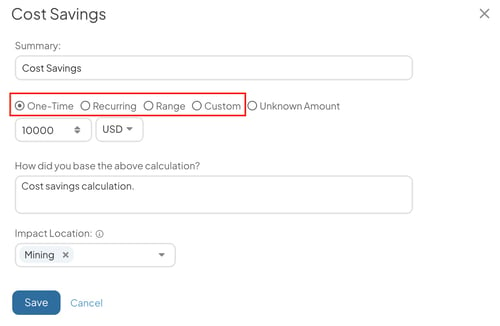
Select Total, One-Time, or Recurring
When you enter an Impact into the Resolution of an Item, you are asked to select whether the frequency is One-Time, Recurring, Range, or Custom. Because Impacts can be classified in this way, KaiNexus also provides a way to sort and report on different frequencies.
Warning: The frequency options appearing in the Resolution depend on your organization's configuration for each Impact. To change which frequencies are available, reach out to your Customer Success Manager. Only organizations with the Advanced ROI module can use Range and Custom frequencies.
When building a Report, you have three options that help you differentiate between Impacts logged with various frequencies.
- Total will include all Impact data that meets your other parameters regardless of whether it was logged as One-Time, Recurring, Range, or Custom Schedule.
- One-Time will include Impact data that has been recorded as a One-Time, Range, or Custom Schedule Impact. It will not include Recurring Impacts.
- Recurring will include only Impact data that has been logged as a Recurring Impact. It will not include One-Time, Range, or Custom Schedule Impacts.
Resolution Type
Warning: Only organizations with the Advanced ROI module can log and report on Forecast and Target Impacts.
When visualizing Impact data, you'll select which Resolution Type you want to display.
- Actual will only include Impact data logged in the Actual Resolution. This helps you report on the actual outcome of completed Items.
- Forecast will only include Impact data logged in the Forecast Resolution. This helps you report on expected outcomes of in-progress Items.
- Target will only include Impact data logged in the Target Resolution. This helps you report on outcomes an Item's Team hopes to reach.
Example of the Actual, Forecast, and Target options you will see if you have the Advanced ROI module enabled.
Examples
Example One:
Question: What data will the Revenue Generation - Recurring - Actual Impact series show?
Answer: It will show Impacts within the Revenue Generation category that are logged as Recurring in the Actual Resolution of Items.
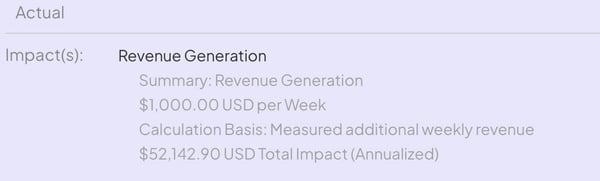
Example of an Impact that will be included in a Revenue Generation - Recurring - Actual Report
Example Two
Question: What data will the Total Financial Impact - Target Impact series show?
Answer: It will show the monetary value of all Quantitative Impacts, including soft savings, that are logged in the Target Resolution of Items. 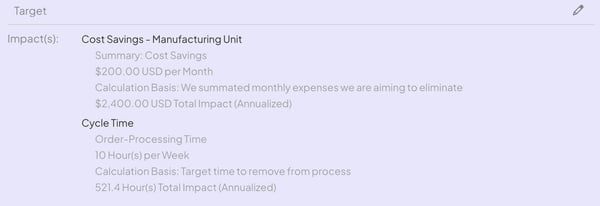
Example of two Impacts that will be included in a Total Financial Impact - Target Report. Note that the monetary value of the Cycle Time Impact is determined by the hourly rate of the Order-Processing Time.
Example Three
Question: What data will the Product (Values) - One-Time - Forecast Impact series show?
Answer: It will show the units of Product that have been logged as a One-Time Impact in the Forecast Resolution of Items.
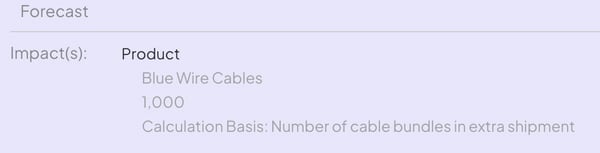
Example of an Impact that will be included in a Product (Value) - One-Time - Forecast Report.
Visualize Impact using these Reports:
For more information on how you can use Reports to visualize and review Impact, check out the articles below:
Recommended Reading:
Do you want to learn more about Impact in KaiNexus? We recommend reading the articles below: