The Cycle Time by Person Report shows you the average time it takes for a person's Items to be completed and how long they remain in each status.
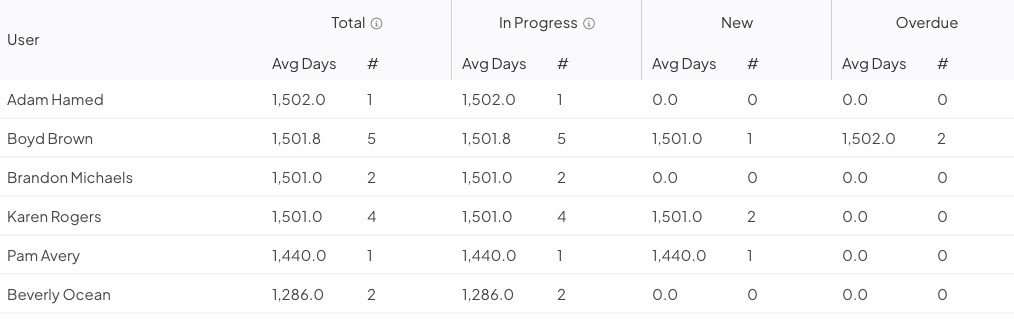
Example of a Cycle Time by Person Report.
/Ofie/Ofie%20Profile%20Pic.png?width=50&height=50&name=Ofie%20Profile%20Pic.png) Important: Due to the cycle time refactor in our 3.2.3 release, all Status data prior to December 6th, 2024, has been cleared from this Report and replaced with a more accurate tracking method. As a result, if an Item entered a certain Status before this date, the time spent in that Status will not appear in the Report unless it is manually logged in the Item's Status History.
Important: Due to the cycle time refactor in our 3.2.3 release, all Status data prior to December 6th, 2024, has been cleared from this Report and replaced with a more accurate tracking method. As a result, if an Item entered a certain Status before this date, the time spent in that Status will not appear in the Report unless it is manually logged in the Item's Status History.
Who can access this Report?
Anyone with the "View Report Data" permission can see this Report.
This Report can be accessed under the Activity section of the Reports page. It can also be added as a Card on a Board.
Working with the Report
- Understand the data
- Change the Report's view
- Use filters to control which data are referenced by the Report
- Customize the Report's columns
- See a list of Items referenced by the Report
- Share the Report
The data
This Report displays the total time a user's Items take to be completed, the amount of time their Items are considered "in progress," and the amount of time their Items spend in each status. For this Report:
- Total: Represents the average time a user's Items take to go from the New to the Completed status, including the time spent in the Planned and Deferred statuses, but not the Draft status.
- In Progress: Represents the average time a user's Items take to go from the New to the Completed status, not including the time spent in the Planned, Deferred, or Draft statuses.
- New to Active: Represents the average time a person's Items take to go from New to Active Status, including time spent in Planned Status. All other Statuses are excluded.
- Active to Complete: Represents the average time a person's Items take to go from Active to Complete, including time spent in Overdue and Resolution Submitted Status. All other Statuses are excluded.
This Report can tell you a lot about the health of your improvement culture:
- People who take significantly longer to complete Items or whose Items spend a long time in the Overdue status may need additional coaching or may need help deligating their work.
- People whose Items spend a long time in the New or Resolution Submitted status may indicate a bottleneck. Their team leader or manager may need additional coaching.
The views
The Cycle Time by Person Report has two views. Select the name of the view you want to see to toggle between them. 
- List: This view displays users in a list format with customizable columns that show data from different stages of the Item life cycle.

- Graph: This view displays cycle time data as a bar graph.

- Display as Bar: Expand the drop-down to select the dataset that should be represented on the graph. For each option, you can display either the average number of days (Avg Days) Items of each person's Items spent in the selected Status(es) or the Item count (#).
- Set the display option to Statuses—Avg Days or Statuses—# to visualize cycle time data for multiple statuses simultaneously, broken down by each person in the report.
- Sort: Expand the drop-down to select which criterion this dataset should be ordered by.
- Max: Enter the number of data points that should be represented on this graph. By default, this Report will show 15 data points, but it can be configured to show 1-53.
- Show Values: When selected, the graph will display the value of each data point.
- Display as Bar: Expand the drop-down to select the dataset that should be represented on the graph. For each option, you can display either the average number of days (Avg Days) Items of each person's Items spent in the selected Status(es) or the Item count (#).
/Ofie/Ofie%20Profile%20Pic.png?width=50&height=50&name=Ofie%20Profile%20Pic.png) Pro Tip: Want more control over Graph view? Customize the Report's Graph Options to rename the X- and Y-axes, adjust label angles or truncation, and make other display tweaks.
Pro Tip: Want more control over Graph view? Customize the Report's Graph Options to rename the X- and Y-axes, adjust label angles or truncation, and make other display tweaks.
The filters
Any relevant filters in use on the main Reports screen will be automatically applied to this Report but can still be configured as needed.
- There are two date-based drop-downs. First is the "Reference Date" drop-down, and second is the "Range" drop-down.

- Reference Date: Expand the drop-down to choose which type of date should be referenced by the Report. For example, select "Created in" if you want the Report to reference only those Items that were created in the specified date range.
- Range: Expand the drop-down to choose the range of dates that should be included in the Report.
- All Time removes any date range parameters.
- Custom allows you to enter any date range you want.
- Past shows you a rolling date range that counts back from the current calendar date.
- Current shows you data for the current week, month, quarter, or year.
- Last shows you data for the previous week, month, quarter, year, or multi-year period.
Pro Tip: The Last YTD option helps you set a date range matching the current year-to-date period but for the previous year instead. For example, if it is March 15th, 2024, and you select Last YTD, your Report will cover data from January 1st, 2023, to March 15th, 2023. This logic is also true for the Last MTD and QTD options.
- Workflow: Expand the drop-down to choose which workflows should be included in the Report.
- Template: Expand the drop-down to choose which Templates should be included in the Report.
- Click the filter icon, and the Item Filter window will open.

- Update the item filters to control which Items are included in the Report's metrics.
- Click Save.
- Click the user icon, and the User Filter window will open.

- Update the user filters to control which users will be listed in the Report.
- Click Save.
- Click the Locations panel on the left side of the Report to expand it.
- Filter the Report by Location and only Items tied to the selected Locations will be included in the Report.
- By default, the Report will display data from Items where each user has filled any Team Role. Use the Team Role selections to specify whether only certain Team Roles should be considered when compiling Report data.

- If the Team Role is highlighted in gray, Items where the user has filled that Team Role are included in the Report data.
- Select one of the Team Roles highlighted in gray to toggle off that Team Role. Items where each user has filled that Team Role will no longer be included in the Report data.
- You can pick any combination of Team Roles using the toggles.
- If you want to turn on all Team Roles or turn off all Team Roles but one, hover over one of the Team Roles.

- Select Only to turn off all other Team Roles besides the one you selected.
- Select All to turn on all Team Roles.
Customize the Report's columns
By default, your report will have columns for User, Total, In Progress, and the primary Status for every Status Type except for Draft and Complete. However, you can add and remove columns depending on which data you're interested in.
To customize the columns on your report:

- Hover over the header of an existing column on your Report.
- Select the drop-down arrow.
- Hover over Columns to see the available columns.
- Select the checkbox next to a column to include it in your Report.
- De-select the checkbox next to a column to remove it from your Report.
- Each Item Status column can include Avg Days and # secondary columns. Hover over the name of a primary column to see the secondary column options.
See a list of Items referenced by the Report
Select any metric in the Report to open a list of Items contributing to that data point.

The Item List will include a "Days in Status" column that displays each Item's individual contribution to the average. This makes it easy to identify outliers and take action.

Share the Report
To share the Report, select the ellipsis icon. In the resulting drop-down menu, you can export the Report as a PDF, download it as an XLSX file, or copy it to a Board.

- Select Print/Save PDF to export the Report as a PDF. The "Print" window will open.
- Page Size: Expand the drop-down to choose your preferred page size.
- Scale: Expand the drop-down to choose the scale percentage. This allows you to fit more content on a single page. For example, selecting 50% doubles the amount of content you can fit on one page. Make sure to select "Fit to page" in your browser's print settings.
- Click either Portrait or Landscape to choose the PDF's orientation.
- Click Print.
The Location of the Report will appear on the exported PDF beneath the Report title.
- Select Save XLSX to export the Report as a spreadsheet document. This option is only available when the Report is in List view.
- Select Copy to Board to add the Report as a Card on a Board.
- In the resulting window, select a Board. All Boards that you have permission to edit will appear as options.
- Select Copy to add the Report to your selected Board. All filters and columns included on the Report will be carried over to the Card.
- The Report Card will appear at the Board's top left corner.
Recommended Reading
Check out the following support page to learn about how Status data is tracked on Items: