
The Multi Chart Importer lets you update multiple charts with a single Excel import.
![]() REQUIRED: The Chart Module is required to perform the functions on this support page. Reach out to your Customer Success Manager to enable Charts for your organization.
REQUIRED: The Chart Module is required to perform the functions on this support page. Reach out to your Customer Success Manager to enable Charts for your organization.
The Multi Chart Importer is a great tool for when you need to import data for a bunch of different Charts at the same time.
If you want to quickly copy a bunch of data from a spreadsheet into a single Chart, check out this article on single-Chart imports instead.
With data imports you can:
- Update dates or categories
- Update data for an existing date or category
- Add new rows of data
- Delete existing rows of data
Who can use the Multi Chart Importer?
- Anyone with the "Multi Chart Import" permission can import updates to any Chart in their organization.
Getting started
Create the Charts
Data can't be imported until all data series have been created and the Chart has been saved with those series in place, so the first step is to create each Chart if you haven't already. If you still need to build out your Charts, check out the articles for your type of Chart — Threshold, Control Limit, Bowling, Bar/Line, or Pareto — first.
Export the Charts' data
The easiest way to make sure your spreadsheet is formatted correctly for each Chart is to export the Chart's data and use the columns included in that spreadsheet as a launch point.
To do so, open the Chart with which you want to work, then:
- Click Actions in the top right corner of the page.
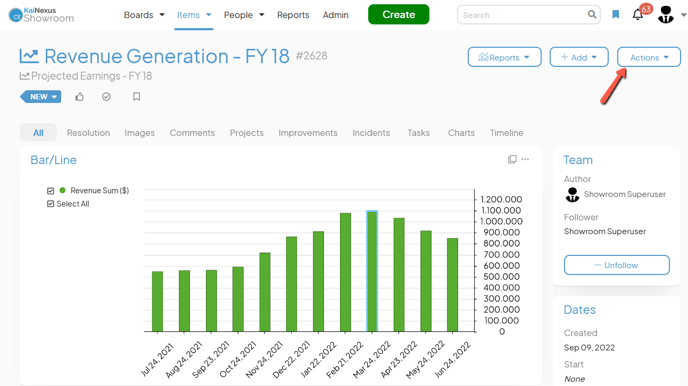
- Click Edit Chart in the resulting drop-down menu and the Chart's Edit Data window will open.
- Click the Excel File icon.
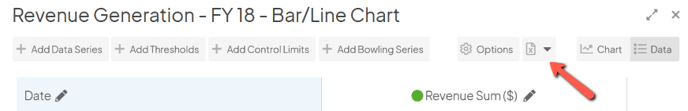
- Click Download in the resulting drop-down.
- If your Chart is using dates, you will need to select a Time Zone and then click Download in the resulting window.
- When the .XLSX document has finished downloading, open it.
The spreadsheet will include:
- A "Date" or "Category" column (depending on which the Chart uses).
- An "Update Date" or "Updated Category" column (again, depending on which the Chart uses). Apart from its header, this column will be empty.
- A column for each series on the Chart which includes its data points. Any calculated data series will be included, but you needn't worry about updating their data as KaiNexus will do it automatically when the Chart is next saved.
/Ofie/Ofie%20Profile%20Pic.png?width=50&height=50&name=Ofie%20Profile%20Pic.png) Pro Tip: If the Chart includes Annotations, there will be an additional tab that includes data for each Annotation. You can disregard this tab if you are not adding new Annotations through the Multi Chart Importer.
Pro Tip: If the Chart includes Annotations, there will be an additional tab that includes data for each Annotation. You can disregard this tab if you are not adding new Annotations through the Multi Chart Importer.
Update the spreadsheet for each Chart as needed
Update dates or categories
- Leave the "Date" or "Category" column untouched.
- Find the row you want to update, then enter the new date or category into the "Updated Date" or "Updated Category" column.
Update data for an existing date or category
- Find the row you want to update, then enter the new value into the column of the data series you want to update.
Add new rows of data
- Enter the new row's date or category into the "Date" or "Category" column.
- Enter the new row's value(s) into the column of each data series.
Delete existing rows of data
- Add a new rightmost column called "Remove Row"
- Find the row(s) you want to delete, and add "TRUE" into its "Remove Row" column.
- Leave the "Remove Row" column blank (or add "FALSE") for any row you don't want to delete.
/Ofie/Ofie%20Profile%20Pic.png?width=50&height=50&name=Ofie%20Profile%20Pic.png) Pro Tip: KaiNexus imports support spreadsheets that utilize formulas, so feel free to use them while populating data on your spreadsheet.
Pro Tip: KaiNexus imports support spreadsheets that utilize formulas, so feel free to use them while populating data on your spreadsheet.
Prepare the spreadsheet you will use for the Multi Chart Import
- Create a tab for each Chart you plan to update.
- Use each Chart's KaiNexus ID number as the name of its designated tab. You can add additional detail to each tab, but the ID number must be listed first.
- Copy and paste the contents of each exported and updated spreadsheet into the corresponding tab. Be sure to include all column headers and every row of data.
- Save the spreadsheet.
Using the Multi Chart Importer
Once your XLS/XLSX file has been prepared as described above, you're ready to import it. To do so, navigate to the Admin area, then click Multi Chart Importer.
- Time Zone: Expand the drop-down to choose which time zone should be used while updating any Charts that use dates.
- Drop xls/xlsx file or click to upload: Either drag the file you want to import onto the upload box or click inside the box and choose the correct file from your computer.
- A summary screen will appear with details about your import. Click Ok, got it.
- The Charts you updated will include a timeline entry stating you imported Chart data.
Pro Tip: Do you want to use the Multi Chart Importer but don't have access to the Admin section? No problem. As long as you have the Multi Chart Import Permission, you can complete a Multi Chart Import using this link:
orgcode.kainexus.com/#admin/chartimport
Important: Remember to replace "orgcode" with the identifier for your organization that appears at the beginning of your KaiNexus URL.
Understanding the import summary
- The words “Import Complete” with no warnings means that the import was successful and your data was uploaded.
- The words “Import Complete” accompanied by a list of “Import warnings” means that the import has finished, but that there were some aspects that failed. In fact, it’s possible that so many elements failed that you won’t see any changes in your Chart’s data.
The components that failed will not have been updated and you will need to correct the mistakes in the spreadsheet and try again.
Each line of the import warnings gives a brief description of the problem and often tells you exactly in which cell the problem arose. For example:
- "Chart #1812: Could not find ID" means that there's a tab in your spreadsheet called "1812" that does not correspond with a Chart in KaiNexus. You will need to check the formatting of the tab's name and make sure that the ID number is correct before that Chart will be updated.
- “Data - column G - row 5: Expected cell of type NUMERIC but received type STRING” means the formatting of cell G5 is incorrect. You will need to edit the formatting of that cell and make it a numeric value before that data point will be uploaded.
-
- “Data: The series ‘Accident Rates’ is not present in the import" means that your spreadsheet is missing the column/data series by that name. You will need to add it before changes can be made to that data series.
-
- “Data - column B - Row 1: There is no existing series that matches ‘Finances’” means that you had a header in column B called “Finances,” but there’s no data series in your Chart that shares that name. You will need to either correct the name in your Excel spreadsheet to make it match an existing series, or you will need to create a series with that name in your KaiNexus Chart, save the Chart, and try importing it again.
Can I update Annotations in my import?
Annotations cannot be edited or deleted using the Multi Chart Importer. You can only add new Annotations. For this reason, we recommend managing Annotations within KaiNexus.
If you do want to add Annotations during your Import, we recommend starting by exporting a Chart that already has at least one Annotation. This will add an additional tab to your spreadsheet that includes the correct import format for Annotations.
Follow these additional steps to add Annotations using the Multi Chart Importer:
- Navigate to the Annotations tab of the exported XLSX file.
- Delete any rows that include existing Annotations on the KaiNexus Chart. If you do not remove the existing rows, the Annotations will be added to the Chart a second time when the file is imported. Leave the top row with the column titles in place.
- Enter information for the Annotation you want to add in a new row.
- Enter the data series in which the Annotation should be included
- Enter the date or category where the Annotation should be placed
- If the Annotation is free text, enter the appropriate text in the Note column
- If the Annotation is an Item, enter the Item ID in the Item ID column
- Copy the data in the Annotations tab to a new tab in the master spreadsheet that will be used for the Multi Chart Import.
- Name the tab "Item ID - Annotations". You can add additional detail to each tab, but the ID number then "- Annotations" must be listed first.