In addition to measuring the engagement of Users and Locations, you can also evaluate engagement by Persona. Personas are a great way to classify Users who may have vastly different goals and responsibilities based on their role in improvement, whether as frontline workers, team leaders, or executives. Discerning how each Persona participates in improvement helps you gain a better understanding of your organization’s improvement culture.
An Engagement by Persona Report tells you which Personas have been consistently logging into KaiNexus, interacting with the system, earning badges, and submitting improvements.
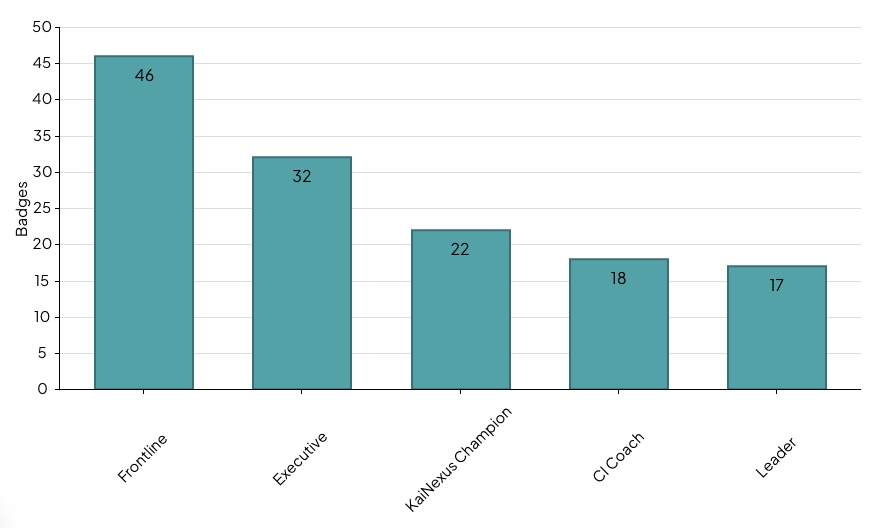
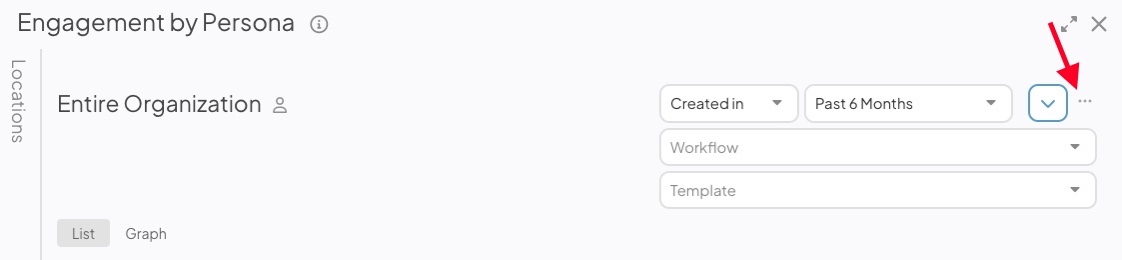
Example of an Engagement by Persona Report showing which Personas have earned the most badges.
Who can access the report?
Anyone with the “View Report Data” Permission will be able to see this Report and access it under the Engagement section of the Reports page.
To display the Report on a Board, add it as a Card.
Working with the report
- Understand the Report's data
- Understand the Report’s Views
- Use Filters to Control which data is referenced by the Report
- See a List of people referenced by the Report
- Share the Report
Understand the Report's data
This Report displays different metrics for user engagement in the platform. In this Report:
- Logged In (%): Represents the percentage of a Persona's Active users who have logged into KaiNexus in the set timeframe.
- Used System (%): Represents the percentage of a Persona's Active users who used KaiNexus in the set timeframe. "Used the system" is defined as doing an activity in the system that generated a Timeline entry, such as entering a comment or resolving an Item.
- Liking and acknowledging Items does not count as using the system.
- The Template, Workflow, and reference date filters do not affect Used System (%).
- Submitted Item (%): Represents the percentage of a Persona's users that have submitted an Item during the set timeframe.
- Annualized Submissions: Represents the annualized number of Item submissions by a Persona's users during the set timeframe.
- Badges: Represents the total number of Badges earned by a Persona's users.
Choose the Report view
The Engagement by Persona Report has two views: List and Graph. To toggle between them, click the name of the view you want to see.
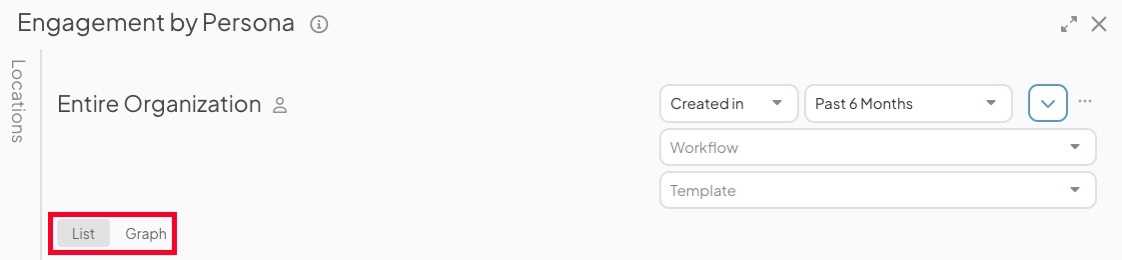
- List view shows the percentage of users with each Persona that have logged into the system, used the system, and submitted an Item. It can also show the number of Badges awarded to each Persona and the total number of people holding each Persona.
- Graph view displays data in a bar graph.
- Display as Bar: Expand the drop-down to select which dataset you want the graph to represent. By default, the Engagement by Persona Report will show the percentage of people with each Persona who have logged into the system.
- Sort: Expand the drop-down to select the criterion you want the dataset ordered by.
- Show Values: When enabled, the value of each data point will be displayed on the graph.
/Ofie/Ofie%20Profile%20Pic.png?width=50&height=50&name=Ofie%20Profile%20Pic.png) Pro Tip: Want more control over Graph view? Customize the Report's Graph Options to rename the X- and Y-axes, adjust label angles or truncation, and make other display tweaks.
Pro Tip: Want more control over Graph view? Customize the Report's Graph Options to rename the X- and Y-axes, adjust label angles or truncation, and make other display tweaks.
Regardless of the view, you should look for:
- Personas that have high engagement scores. Employees with this Persona are highly involved with your organization’s improvement system.
- Personas that have low engagement scores. Employees with this Persona may need additional coaching to increase their involvement.
Add Filters to customize the Report
Any relevant Filters active on the main Reports screen will automatically be applied to your Report, but the Report can still be configured as needed.
- There are two date-based drop-downs that will Filter the Report for data within a specified time.
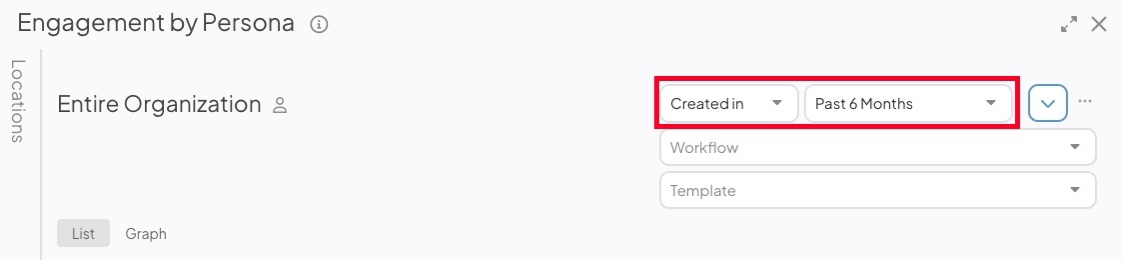
- Reference Date: Expand the drop-down to choose which type of date should be referenced by the Report. For example, select “Created in” if you want the Report to reference only Items that were created in the specified date range.
- Range: Expand the drop-down to choose the range of dates that should be included in the Report.
- All Time removes any date range parameters.
- Custom allows you to enter any date range you want.
- Past shows you a rolling date range that counts back from the current calendar date.
- Current shows you data for the current week, month, quarter, or year.
- Last shows you data for the previous week, month, quarter, year, or multi-year period.
Pro Tip: The Last YTD option helps you set a date range matching the current year-to-date period but for the previous year instead. For example, if it is March 15th, 2024, and you select Last YTD, your Report will cover data from January 1st, 2023, to March 15th, 2023. This logic is also true for the Last MTD and QTD options.
- Workflow: Expand the drop-down to choose which Workflows should be included in the Report.
- Template: Expand the drop-down to choose which Templates should be included in the Report.
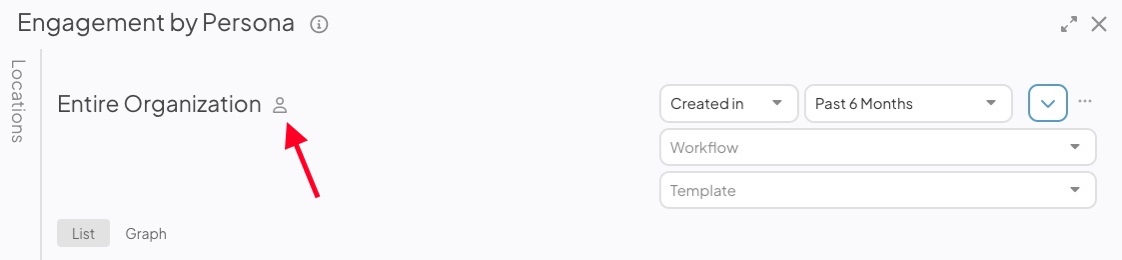
- Select the user icon beside “Entire Organization” to open the User Filter window. Update the user filters to control which Users will be in the Report and click Save. For example, you could Filter for certain System Roles or a list of specific people you are curious about, allowing you to create highly granular and specialized reports.
- Select the Locations panel on the left side of the Report to expand it.
- Filter the Report by Location to view the data for specific Locations within your organization.
See a List of people referenced by the Report
When in the List view:
- Click the number representing a Persona’s Badges or people values to see a List of all users included in the data.
When in Graph view:
- Click a bar to see a List of Items pertaining to that Persona.
Share the Report
To share the Report, select the ellipsis icon. In the resulting drop-down menu, you can export the Report as a PDF, download it as an XLSX file, or copy it to a Board.
- Select Print/Save PDF to export the Report as a PDF. The "Print" window will open.
- Page Size: Expand the drop-down to choose your preferred page size.
- Scale: Expand the drop-down to choose the scale percentage. This allows you to fit more content on a single page. For example, selecting 50% doubles the amount of content you can fit on one page. Make sure to select "Fit to page" in your browser's print settings.
- Click either Portrait or Landscape to choose the PDF's orientation.
- Click Print.
The Location of the Report will appear on the exported PDF beneath the Report title.
- Select Save XLSX to export the Report as a spreadsheet document. This option is only available in the List view.
- Select Copy to Board to add the Report as a Card on a Board.
- In the resulting window, select a Board. All Boards that you have permission to edit will appear as options.
- Select Copy to add the Report to your selected Board. All filters and columns included on the Report will be carried over to the Card.
- The Report Card will appear at the Board's top left corner.