Evaluate the health of each Location's improvement culture by tracking the extent to which its people are engaging with KaiNexus.
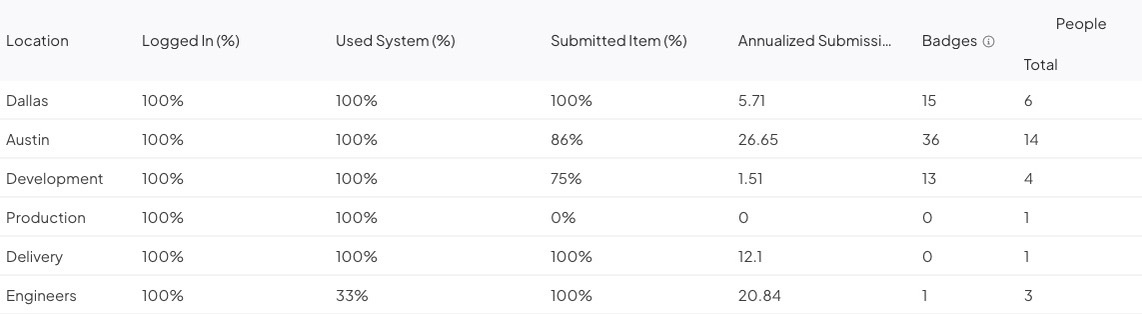
Example of Engagement by Location Report in List view. For each Location in the Report, you can view key engagement information such as the percent of people who have logged in, submitted Items, and more.
Who can access this Report?
Anyone with the "View Report Data" permission will be able to see this Report.
This Report can be accessed under the Engagement section of the Reports page. It can also be added as a Card on a Board.
Working with the Report
- Understand the data
- Understand the Report's views
- Use filters to control which data are referenced by the Report
- See a list of people referenced by the Report
- Share the Report
The data
This Report displays different metrics for user engagement in the platform. In this Report:
- Logged In (%): Represents the percentage of a Location's Active users who have logged into KaiNexus in the set timeframe.
- Used System (%): Represents the percentage of a Location's Active users who used KaiNexus in the set timeframe. "Used the system" is defined as doing an activity in the system that generated a Timeline entry, such as entering a comment or resolving an Item.
- Liking and acknowledging Items does not count as using the system.
- The Template, Workflow, and reference date filters do not affect Used System (%).
- Submitted Item (%): Represents the percentage of a Location's users that have submitted an Item during the set timeframe.
- Annualized Submissions: Represents the annualized number of Item submissions by a Location's users during the set timeframe.
- Badges: Represents the total number of Badges earned by a Location's users.
The views
This Report has three views. Click the name of the view you want to see to toggle between them.

- List: Shows the percentage of users in each Location that have logged into the system, used the system, or submitted an Item, as well as their annualized number of submissions, the number of Badges that have been awarded to them, and the total number of people in that Location.
- Hover over a column's header and click the caret icon, then hover over Columns to add and remove columns from the list, or click Sort Ascending or Sort Descending to sort the list by that column in ascending or descending order.
- Tree: This view is similar to List, but it organizes the Locations by their hierarchy in the Network, providing a clearer picture of data flow throughout your organization.
- This view can only display up to 100 Locations.
- Hover over a column's header and click the caret icon, then hover over Columns to add and remove columns from the list.
- Sorting the Report by a particular column will have no effect; the Locations will always be ordered based on the Network structure.
/Ofie/Ofie%20Profile%20Pic.png?width=50&height=50&name=Ofie%20Profile%20Pic.png) Pro Tip: Try adding the Level Type column to provide more context on the level each Location sits at in your organization.
Pro Tip: Try adding the Level Type column to provide more context on the level each Location sits at in your organization.
- Graph: Displays the selected data as a bar graph. The color of the bars will match each Location's Level Type icon.
- Display as Bar: Expand the drop-down to select the dataset that should be represented on the graph. By default, this Report will show the percentage of people in each Location who have logged into the system.
- Sort: Expand the drop-down to select by which criterion this dataset should be ordered.
- Max: Enter the number of data points that should be represented on this graph. By default, this Report will show 15 data points, but it can be configured to show 1-50.
- Show Values: When enabled, the value of each data point will be displayed on the graph.
Pro Tip: Want more control over Graph view? Customize the Report's Graph Options to rename the X- and Y-axes, adjust label angles or truncation, and make other display tweaks.
Regardless of the view, you should look for:
- Locations that have high engagement scores. The employees and leaders there deserve recognition!
- Locations with low engagement scores. You may want to provide coaching to get those employees involved in the organization’s improvement efforts
Filters
Any relevant filters in use on the main Reports screen will be automatically applied to this Report but can still be configured as needed.
- There are two date-based drop-downs. First is the "Reference Date" drop-down and second is the "Range" drop-down.

- Reference Date: Expand the drop-down to choose which type of date should be referenced by the Report. For example, select "Created in" if you want the Report to reference only those Items that were created in the specified date range.
- Range: Expand the drop-down to choose the range of dates that should be included in the Report.
- All Time removes any date range parameters.
- Custom allows you to enter any date range you want.
- Past shows you a rolling date range that counts back from the current calendar date.
- Current shows you data for the current week, month, quarter, or year.
- Last shows you data for the previous week, month, quarter, year, or multi-year period.
Pro Tip: The Last YTD option helps you set a date range matching the current year-to-date period but for the previous year instead. For example, if it is March 15th, 2024, and you select Last YTD, your Report will cover data from January 1st, 2023, to March 15th, 2023. This logic is also true for the Last MTD and QTD options.
- Workflow: Expand the drop-down to choose which workflows should be included in the Report.
- Template: Expand the drop-down to choose which Templates should be included in the Report.
- Click the user icon and the User Filter window will open.

- Update the user filters to control which users will be listed in the Report.
- Click Save.
- Click the Locations panel on the left side of the Report to expand it.
- Filter the Report by Location and only Items tied to the selected Locations will be included in the Report.
- Level Type: Expand the drop-down to choose the types of Locations that should be listed in the Report.
- The Location & Below checkbox: When selected, each Location on the Report will include data for itself and all Locations nested beneath it. Use this checkbox when you want to see data "roll-up" to higher-level Locations.
- User Type: Expand the drop-down to choose the types of users that should be included in the Report's metrics. This field defaults to Active users, the most common User Type.
- Badges: Expand the drop-down to choose the Badges that should be included in the Report's metrics.
See a list of people referenced by the Report
When in the List or Tree view:
- Click a Location's Badges or People values to see a list of their users.
When in the Graph view:
- Click a bar to open a list of Items in that Location.
Share the Report
To share the Report, select the ellipsis icon. In the resulting drop-down menu, you can export the Report as a PDF, download it as an XLSX file, or copy it to a Board.

- Select Print/Save PDF to export the Report as a PDF. The "Print" window will open. This option is only available in List and Graph view.
- Page Size: Expand the drop-down to choose your preferred page size.
- Scale: Expand the drop-down to choose the scale percentage. This allows you to fit more content on a single page. For example, selecting 50% doubles the amount of content you can fit on one page. Make sure to select "Fit to page" in your browser's print settings.
- Click either Portrait or Landscape to choose the PDF's orientation.
- Click Print.
The Location of the Report will appear on the exported PDF beneath the Report title.
- Select Save XLSX to export the Report as a spreadsheet document. This option is only available in the List view.
- Select Copy to Board to add the Report as a Card on a Board.
- In the resulting window, select a Board. All Boards that you have permission to edit will appear as options.
- Select Copy to add the Report to your selected Board. All filters and columns included on the Report will be carried over to the Card.
- The Report Card will appear at the Board's top left corner.