One of the most common Boards built and used by our customers is a basic Board intended to tell each user about the work going on in their own Location(s). It’s often simply called “My Location Board.”
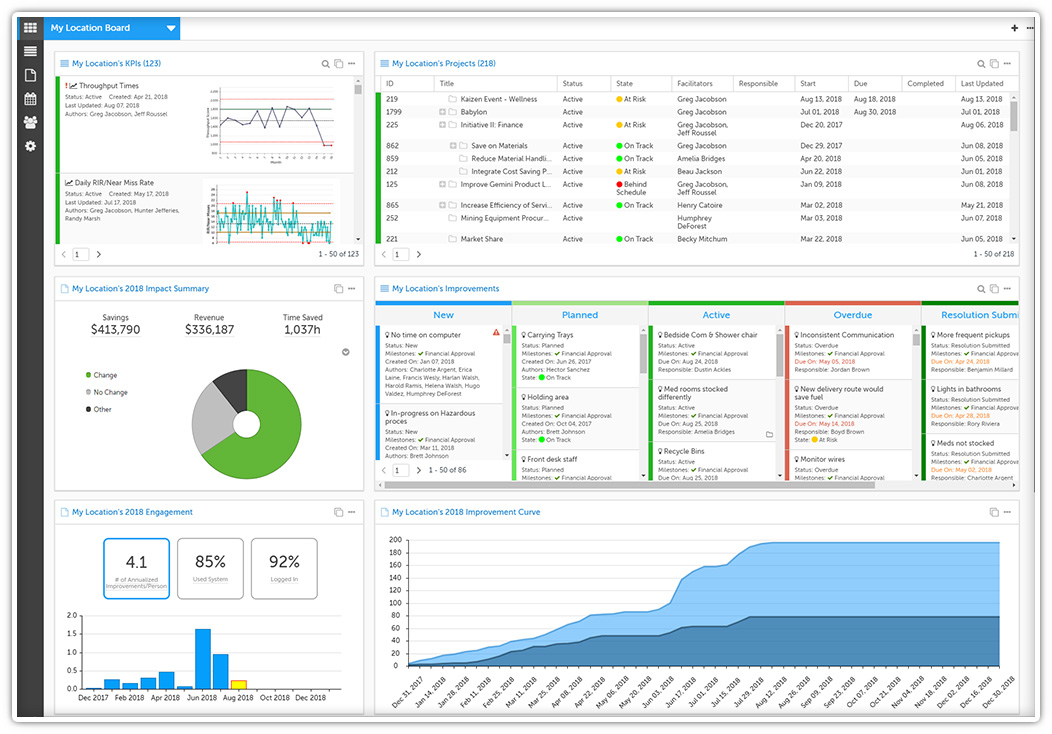
This Board makes heavy use of the “User’s Current Location” filter - that means that whenever a user logs in and looks at this Board, they will see information and data pertaining solely to their Location - without having to change any filters!
For general information on creating a new Board, check out this support page .
For general information on adding new Cards, check out this support page .
How is the Board built out?
This Board often has a two column (⅓, ⅔) layout.
What Cards are included?
Our customers typically include the following Cards, although you can configure the Cards to reflect the precise interests of your team.
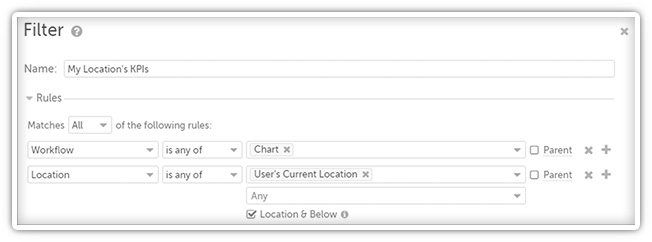
- My Location’s KPIs
This Card displays all Charts affiliated with the current user’s Location.
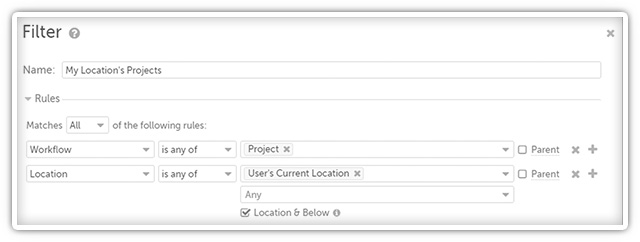
- My Location’s Projects
This Card displays all Projects affiliated with the current user’s Location. The Card is often put into the Tree View so that people can quickly get an understanding of the Project hierarchy.
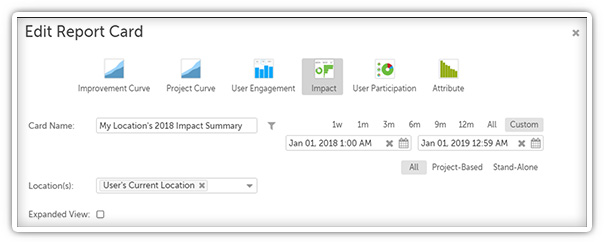
- My Location's 2018 Impact Summary
This Card displays the Impact Summary of the current user’s Location’s improvement efforts for the current year. At the start of each year, you should update the date range to represent the next year.
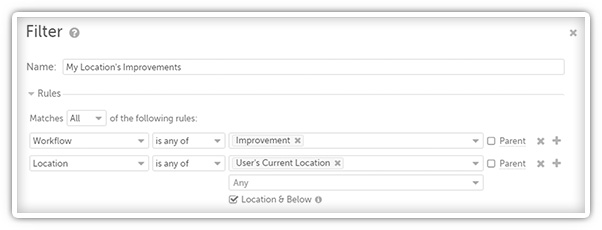
- My Location's Improvements
This Card displays all Improvements affiliated with the current user’s Location. The Card is often put into the Kanban View so that people can quickly get a feel for how loaded each stage of the improvement process is.
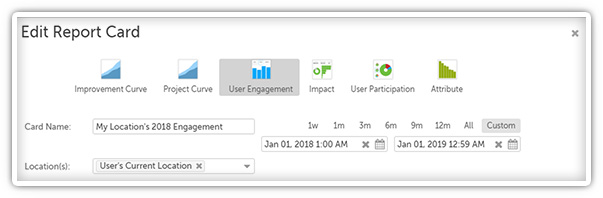
- My Location's 2018 Engagement
This Card displays the User Engagement data of the current user’s Location for the current year. At the start of each year, you should update the date range to represent the next year.
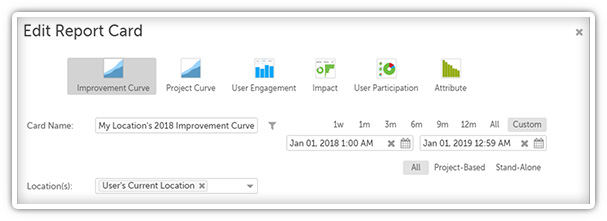
- My Location's 2018 Improvement Curve
This Card displays the Improvement Curve of the current user’s Location for the current year. At the start of each year, you should update the date range to represent the next year.