The continuous improvement model begins with the idea that everyone in an organization can, and should be expected to, get involved in improvement.
KaiNexus allows you to easily measure engagement and see who your improvement leaders are and who needs a little more coaching.
The User Engagement Summary Report
The User Engagement Summary Report helps you to evaluate the health of your improvement culture by tracking the average number of Items submitted per person, the percentage of people who have logged in to KaiNexus, and the number of people who have used the system over a set period of time.
Who can access this Report?
Anyone with the "View Report Data" permission will be able to see this Report.
This Report can be accessed under the Engagement section of the Reports page. It can also be added as a Card on a Board.
The Report's views
This Report has three views. Click the name of the view you want to see to toggle between them.
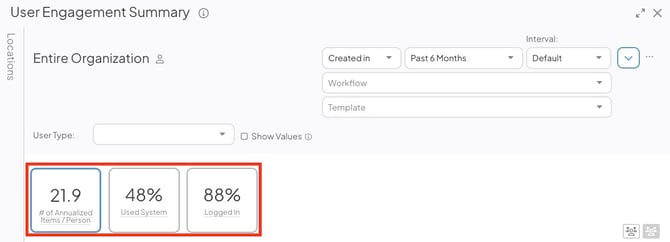
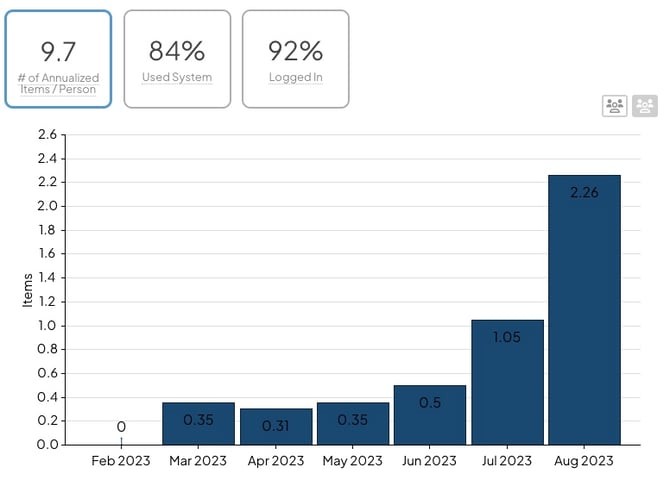
- # of Annualized Items/Person: The number above the name of the view is the annualized number of Items submitted (that meet all filter requirements) divided by the number of Active users.
The graph shows the annualized number of Items submitted in each time period. - Used System: The number above the name of the view is the percentage of Active users who used KaiNexus in the set time frame and specified Locations. "Used the system" is defined as doing an activity in the system that generated a Timeline entry, such as entering a comment or resolving an Item.
The graph shows the percentage of active users who used the system in each time period. - Logged In: The number above the name of the view is the percentage of Active users who have logged into KaiNexus in the set time frame and specified Locations.
The Report's filters
Any relevant filters in use on the main Reports screen will be automatically applied to this Report but can still be configured as needed.
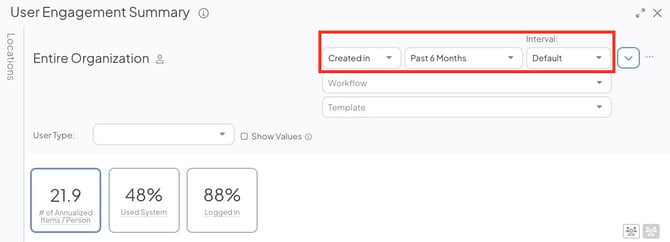
- There are three date-based drop-downs. From left to right, there's the "Reference Date" drop-down, the "Range" drop-down, and the "Interval" drop-down.
-
- Reference Date: Expand the drop-down to choose which type of date should be referenced by the Report. For example, select "Created in" if you want the Report to reference only those Items that were created in the specified date range. This filter will only affect the Number of Annualized Items per Person.
-
- Range: Expand the drop-down to choose the range of dates that should be included in the Report.
- Interval: Expand the drop-down to choose the interval, or "buckets," by which the Report should be organized.
- Workflow: Expand the drop-down to choose which workflows should be included in the Report.
- Template: Expand the drop-down to choose which Templates should be included in the Report.
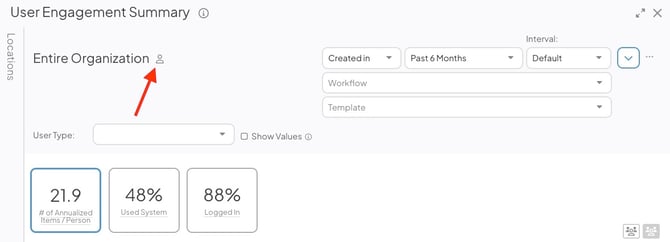
- Select the person icon to open the People Filter.
-
- Use the People Filter to control which Users are included in the Report's metrics.
- Select Save.
- Click the Locations panel on the left side of the Report to expand it.
- Filter the Report by Location and only Items and people tied to the selected Locations will be included in the Report.
- User Type: Expand the drop-down to choose which types of users will be included in the Report.
- The Show Values checkbox: When enabled, the value of each data point will be displayed on the graph.
See a list of people referenced by the Report
For each of the three views, you can generate a list of people who do or do not meet the view's requirements. For example, if you're looking at the "Used System" view, you can see a list of everyone who has used the system or a list of everyone who has not used the system.
To generate one of these lists:
- Put the Report in the view in which you're interested.
- To see a list of everyone who meets the view's requirements, click the transparent users button. This is the button on the left.
To see a list of everyone who does not meet the view's requirements, click the gray users button. This is the button on the right.
/Reports/User%20Engagement%20Summary/User%20Engagement%20Summary%20-%20People%20Toggles.jpeg?width=670&height=240&name=User%20Engagement%20Summary%20-%20People%20Toggles.jpeg)
Filtering the list of users
Filter a list of users to see who is engaged and who could use a little coaching. To do so, open the People List with which you want to work, then:
- Click the Filter icon at the top of the List. If you do not see this option, you may need to first click Filters to expand the List's filters.

- In the resulting window:
- Expand the Engagement drop-down menu to see your options. Select one of those options. After you select a criterion, a new drop-down menu will appear to the right which you can use to specify a time frame.
For example, if you add a criterion for "Submitted Item" in the time frame "Past 14 days," you'll get a list of all users who have submitted an Item within the last 14 days. If you add a criterion for "Not Used System" in the time frame "Past 6 months," you'll get a list of all users who have never used the system or who last used the system more than 6 months ago.
- Expand the Engagement drop-down menu to see your options. Select one of those options. After you select a criterion, a new drop-down menu will appear to the right which you can use to specify a time frame.
![]() The criterion "logged in" simply means that the user has logged in to KaiNexus. The criterion "used the system" means that the user has logged in to KaiNexus and performed some other action, such as commenting on an Item, submitting an Item, resolving an Item, etc.
The criterion "logged in" simply means that the user has logged in to KaiNexus. The criterion "used the system" means that the user has logged in to KaiNexus and performed some other action, such as commenting on an Item, submitting an Item, resolving an Item, etc.
-
- Add any other necessary filters.
- Click Save.
Recommended Reading