The Impact by Person Report lets you see the Impact generated by each person in your organization.
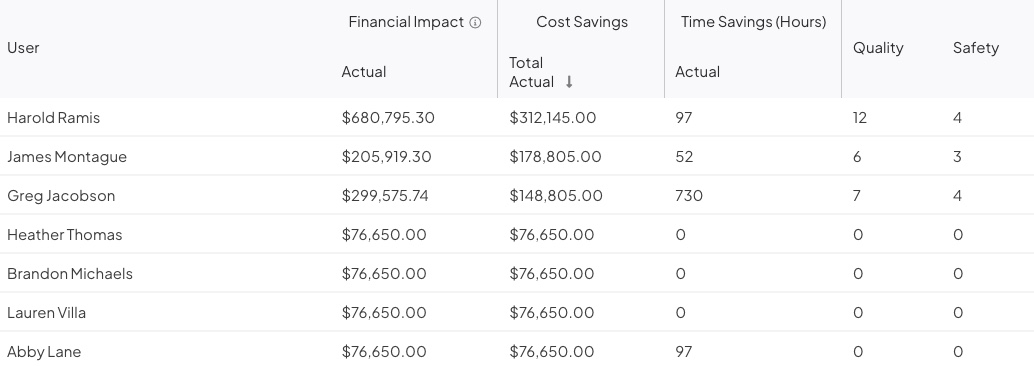
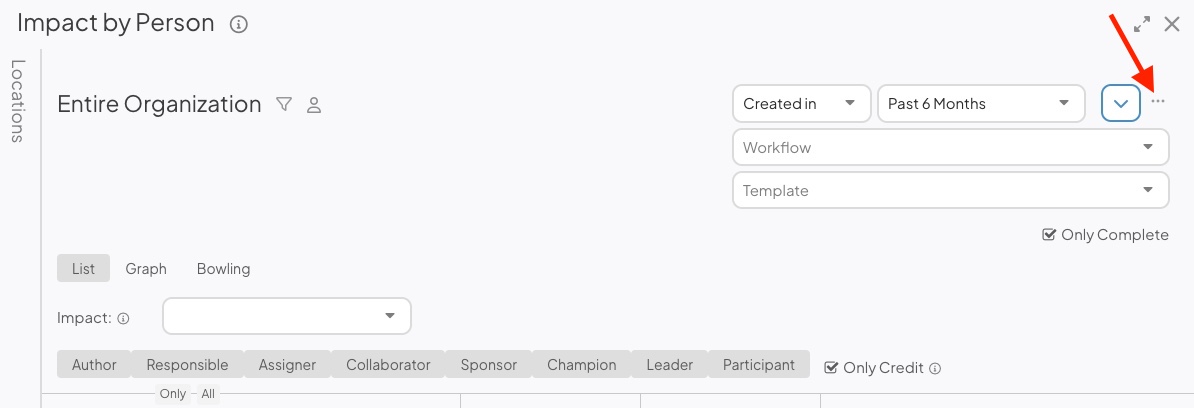
Example of Impact by Person Report in List view. For each Person in the Report, you can view key Impact data for the person's Items.
Who can access this Report?
Anyone with the "View Report Data" and "View Impact" permissions will be able to see this Report.
This Report can be accessed under the Impact section of the Reports page. It can also be added as a Card on a Board.
Working with the Report
- Understand the Report's views
- Use filters to control which data are referenced by the Report
- See a list of Items referenced by the Report
- Share the Report
The views
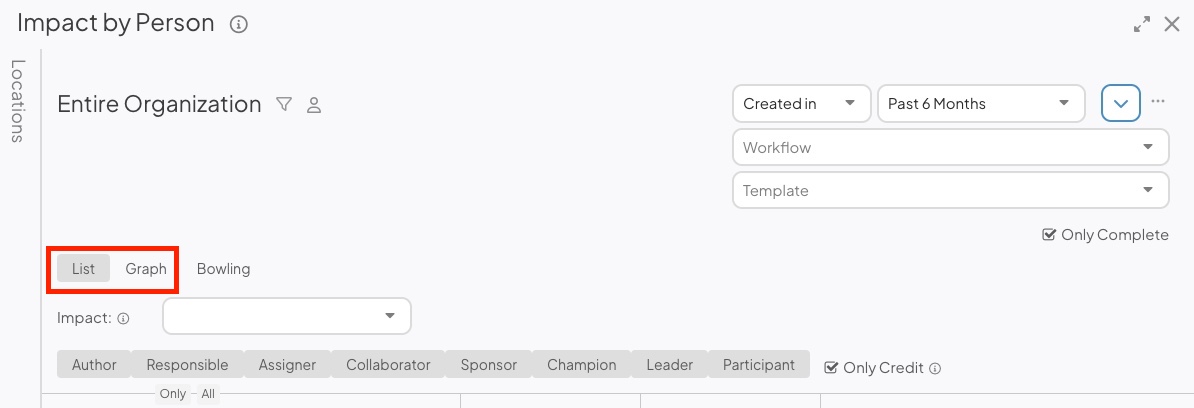
If your organization is not using the Advanced ROI module, this Report will have two views: List and Graph. To toggle between them, select the name of the view you want to see.
- List: Shows the total financial impact of the Items on which each user has filled the specified role, the total time savings of those Items (in time and in monetary amounts), and the number of those Items which resulted in quality, safety, and satisfaction improvements.
- Customize the impact columns on the report by hovering over a column's header and selecting the caret icon.
- Sort Ascending will arrange the data from low to high Impact based on the column you selected.
- Sort Descending will arrange the data from high to low Impact based on the column you selected.
- Columns will open an additional dropdown menu where you can customize which columns appear on the report.
- In addition to columns that report Impact in currency, the Environmental Impact, Product, Resource, and Waste Impact Categories will also have columns that report Impact in their non-currency units. These columns will have "Values" appended to the end of the category name.
- Customize the impact columns on the report by hovering over a column's header and selecting the caret icon.
- Graph: Displays the selected data as a bar graph.
- Display as Bar: Expand the drop-down to select the dataset that should be represented as a bar on the graph. By default, this Report will show the total final impact per user.
- Display as Line: Expand the drop-down to select the dataset that should be represented as a line on the graph.
- Sort: Expand the drop-down to select by which criterion this dataset should be ordered.
- Max: Enter the number of data points that should be represented on this graph. By default, this Report will show 15 data points, but it can be configured to show 1-53.
- Show Values: When enabled, the value of each data point will be displayed on the graph.
/Ofie/Ofie%20Profile%20Pic.png?width=50&height=50&name=Ofie%20Profile%20Pic.png) Pro Tip: Want more control over Graph view? Customize the Report's Graph Options to rename the X- and Y-axes, adjust label angles or truncation, and make other display tweaks.
Pro Tip: Want more control over Graph view? Customize the Report's Graph Options to rename the X- and Y-axes, adjust label angles or truncation, and make other display tweaks.
If your organization uses the Advanced ROI module, this Report will have a third view called Bowling view.

- Bowling view displays Impact data for Items with which each user is associated as a bowling chart, color-coding the Actual Impact based on whether or not it matches or exceeds the Target or Forecast Impact.
- Show: Select any combination of Target, Forecast, Actual, Current Forecast, and Actual Variance to add or remove them from the report.
- By default, Target, Actual, and Forecast Impact will be selected.
- Current Forecast displays the Actual Impact for past time intervals and the Forecast Impact for present and future time intervals. This gives you a dynamic outlook on Impact that considers the current date.
- Actual Variance displays the difference between the Actual Impact and Target or Forecast Impact, depending on which is selected as the reference. This helps you see how much the Actual Impact differs from prior estimates.
- Show: Select any combination of Target, Forecast, Actual, Current Forecast, and Actual Variance to add or remove them from the report.
-
- Reference: Pick which data series you want the Actual Impact to reference when color-coding the chart. You can select Target, Forecast, or None.
- Selecting None will result in a chart that is not color-coded.
- The Column Totals checkbox: When selected, you will see a footer at the bottom of the Report that summates the data in each time interval.
- The Row Totals checkbox: When selected, you will see an additional "Total" column on the left of the time intervals that summates data in each row.
- The YTD checkbox: When selected, the Report displays year-to-date totals to the left of each row.
- Important: The YTD column only aggregates data currently visible on the Report. If data from the current year is not included, the YTD total will be incomplete. Be sure to set the Report’s date range to include the current year's Impact when using the YTD column.
- Reference: Pick which data series you want the Actual Impact to reference when color-coding the chart. You can select Target, Forecast, or None.
-
- The Future Color checkbox: When selected, time intervals in the future will be color-coded according to whether the Actual Impact is greater or lesser than the referenced Impact.
- This checkbox is unselected by default, so future intervals will not show false results due to Actual Impact not being logged yet.
-
Display As: Choose Currency or Unit to control how Impacts are shown in the Report.
- Currency: Shows the financial value of the Impacts.
- Unit: Displays the quantity of Impacts recorded in non-financial units. For example, Time Savings Impacts would be shown in hours.
- If you select this option, we recommend filtering the Report to include either a single Impact Type or Impact Types that use the same unit. This ensures the results are meaningful and prevents mixing different units in the same Report.
- The Future Color checkbox: When selected, time intervals in the future will be color-coded according to whether the Actual Impact is greater or lesser than the referenced Impact.
The filters
Any relevant filters on the main Reports screen will be automatically applied to this Report but can still be configured as needed.
- There are two date-based drop-downs in the List and Graph views, and three in the Bowling view (only available if your organization uses the Advanced ROI module). From left to right, there's the "Reference Date" drop-down, the "Range" drop-down, and the "Interval" drop-down.
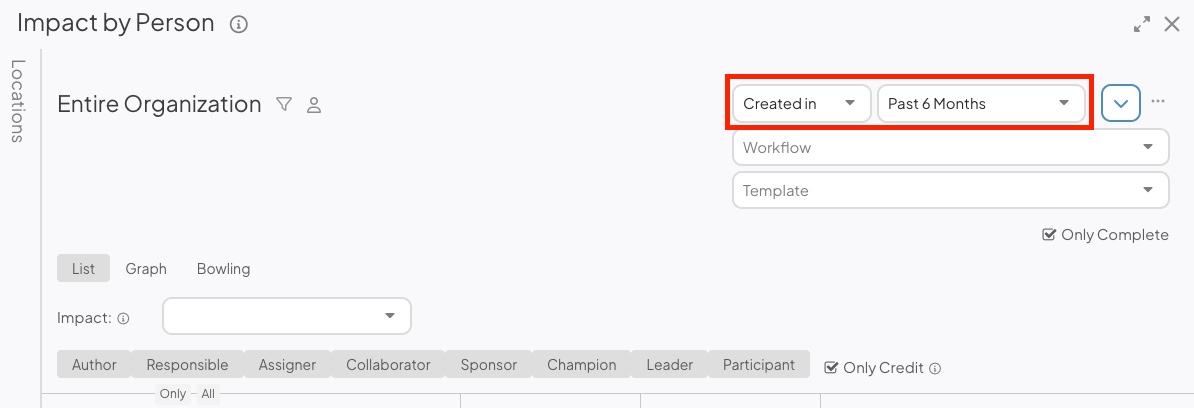
- Reference Date: Expand the drop-down to choose which type of date should be referenced by the Report. For example, select "Created in" if you want the Report to reference only Items created in the specified date range.
- Range: Expand the drop-down to choose the range of dates that should be included in the Report.
- All Time removes any date range parameters.
- Custom allows you to enter any date range you want.
- Past shows you a rolling date range that counts back from the current calendar date.
- Current shows you data for the current week, month, quarter, or year.
- Last shows you data for the previous week, month, quarter, year, or multi-year period.
Pro Tip: The Last YTD option helps you set a date range matching the current year-to-date period but for the previous year instead. For example, if it is March 15th, 2024, and you select Last YTD, your Report will cover data from January 1st, 2023, to March 15th, 2023. This logic is also true for the Last MTD and QTD options.
-
- Interval: Expand the drop-down to choose the interval, or "buckets," by which the Report should be organized.
- Workflow: Expand the drop-down to choose which workflows should be included in the Report.
- Template: Expand the drop-down to choose which Templates should be included in the Report.
- The Only Complete checkbox: When enabled, this Report will only include data from completed Items; when disabled, it includes data from any Item that has a Resolution saved, regardless of status.
- Currency: Two fields control which currencies are included in the Report and whether they are converted to another currency. Multi-currency and currency conversion is only available if your organization has the Advanced ROI Module.
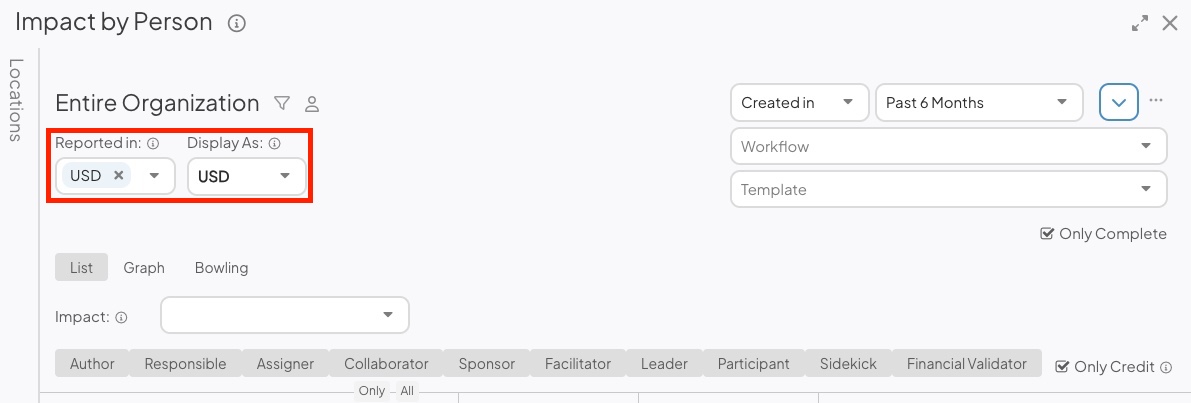
- Reported in(appears only if your organization uses multiple currencies): Select which Impacts are included in the Report based on their currency. The Report will display only Impacts originally logged in that currency.
- If your organization does not use currency conversion, this field will be single-select, and you can only display Impacts in one currency at a time.
- If your organization uses currency conversion, this field will be multi-select. If you want to consider all Impacts in your organization regardless of their currency, then select Any Currency.
- Reported in(appears only if your organization uses multiple currencies): Select which Impacts are included in the Report based on their currency. The Report will display only Impacts originally logged in that currency.
-
- Display As (appears only if your organization uses currency conversion): Select which currency the Report displays. Any currencies selected in the "Reported in" field will be converted to this currency and summated in the Report data.
- This drop-down is single-select. The Report can only display data in one currency at a time.
- Display As (appears only if your organization uses currency conversion): Select which currency the Report displays. Any currencies selected in the "Reported in" field will be converted to this currency and summated in the Report data.
Pro Tip: The system will use your selection in the Reference Date drop-down when determining which Exchange Rate to use for the currency conversion. For example, if you select "Realized In," the Impacts are converted using the Exchange Rate active on their Realized Date. If you select "Created In," Impacts are converted using the Exchange Rate active during their Item's Create Date. Check out our article about setting your organization's Exchange Rates to view current and historical Exchange Rates configured by your organization.
- Click the filter icon, and the Item Filter window will open.
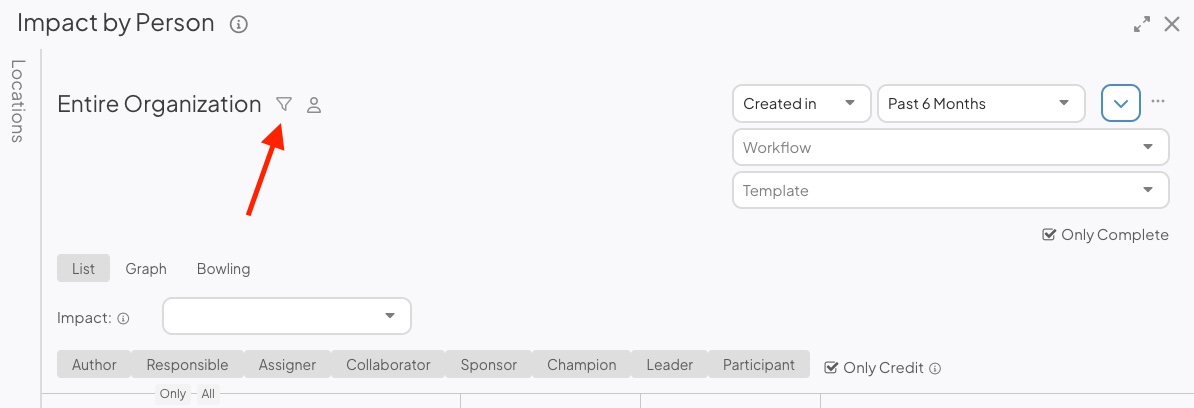
- Update the item filters to control which Items are included in the Report's metrics.
- Click Save.
- Click the user icon, and the User Filter window will open.
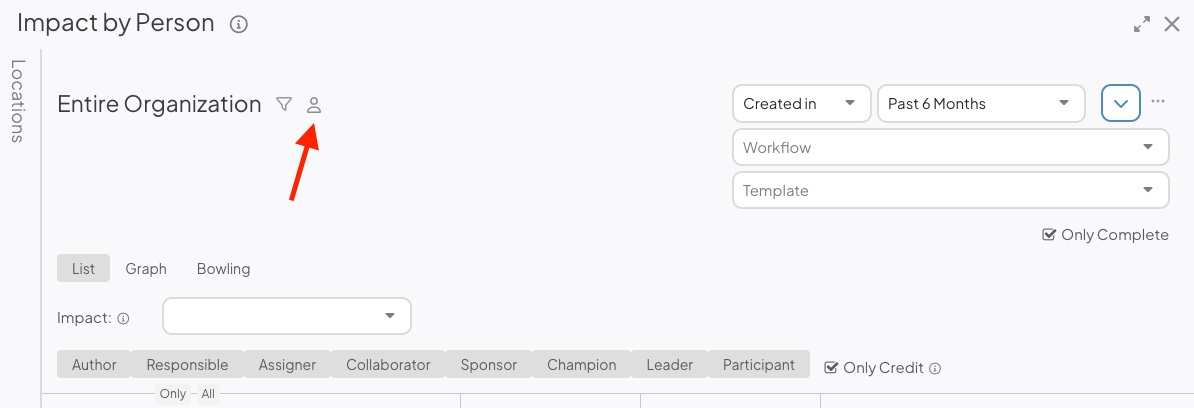
- Update the user filters to control which users will be listed in the Report.
- Click Save.
- Click the Locations panel on the left side of the Report to expand it.
- Filter the Report by Location, and only Items tied to the selected Locations will be included in the Report.
- By default, the Report will display data from Items where each user has filled any Team Role. Use the Team Role selections to specify whether only certain Team Roles should be considered when compiling Report data.
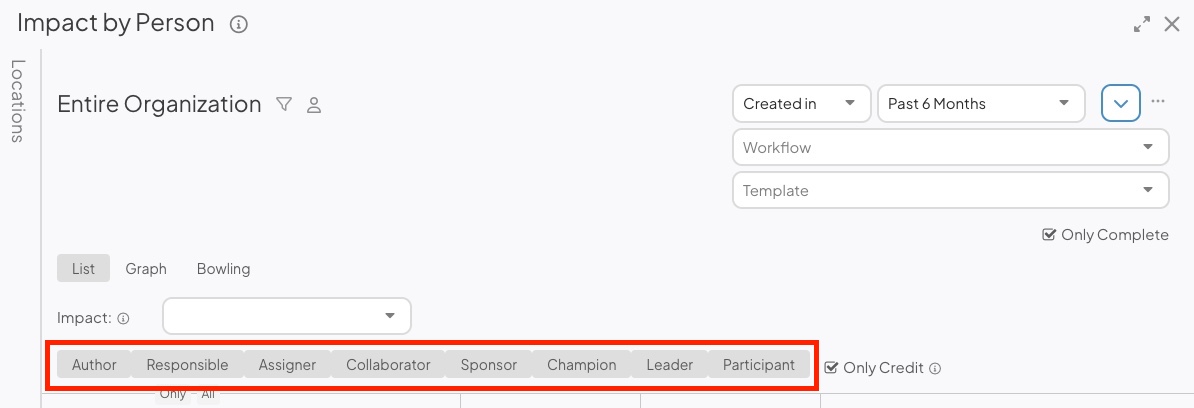
- If the Team Role is highlighted in gray, Items where the user has filled that Team Role are included in the Report data.
- Select one of the Team Roles highlighted in gray to toggle off that Team Role. Items where each user has filled that Team Role will no longer be included in the Report data.
- You can pick any combination of Team Roles using the toggles.
- If you want to turn on all Team Roles or turn off all Team Roles but one, hover over one of the Team Roles.
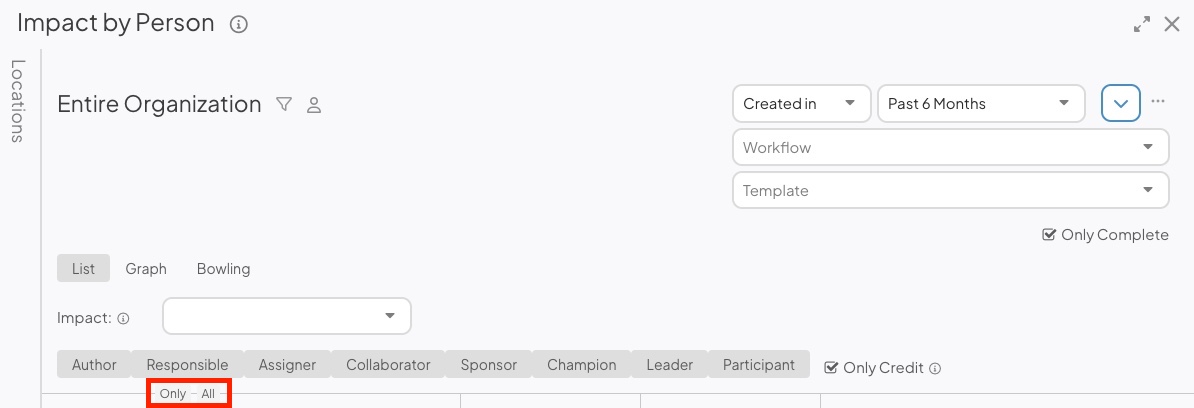
- Select Only to turn off all other Team Roles besides the one you selected.
- Select All to turn on all Team Roles.
- The Only Credit checkbox: This option is only available if your organization is using the Advanced ROI module and has credit splitting enabled. When enabled, the Report will show only the financial impact with which each user was specifically credited.
- Impact: Expand the drop-down to choose the Impact(s) which should be shown on the Report.
- If an Impact supports Impact Values, which are additional classifications beneath the Impact, an additional Impact Values drop-down will appear. Use this dropdown if you want to report on specific Impact Values within an Impact.
- Investment: If your organization has at least one Investment Type, an Investment drop-down will appear. Use it to choose which Investment(s) should appear on the Report.

- The Investment filter is only available in List and Graph view.
![]() If you choose Impacts or Investments via the Item filter instead, the Report will include all data from Items that have at least one of those Impacts or Investments, not just the Impacts and Investments you selected.
If you choose Impacts or Investments via the Item filter instead, the Report will include all data from Items that have at least one of those Impacts or Investments, not just the Impacts and Investments you selected.
See a list of Items referenced by the Report
When in List or Bowling view:
- Click any of a user's numerical or monetary values to see a list of all their Items contributing to that metric.
When in Graph view:
- Hover over a bar or point on a line to open a tooltip that lists its exact value.
- Click a bar or point on a line to open a list of all Items contributing to that metric.
The Item List will include a column that displays each Item's individual contribution to the metric.
Share the Report
To share the Report, select the ellipsis icon. In the resulting drop-down menu, you can export the Report as a PDF, download it as an XLSX file, or copy it to a Board.
- Select Print/Save PDF to export the Report as a PDF. This option is available in List and Graph view.
In the "Print" window:- Page Size: Expand the drop-down to choose your preferred page size.
- Scale: Expand the drop-down to choose the scale percentage. This allows you to fit more content on a single page. For example, selecting 50% doubles the amount of content you can fit on one page. Make sure to select "Fit to page" in your browser's print settings.
- Click either Portrait or Landscape to choose the PDF's orientation.
- Click Print.
The Location of the Report will appear on the exported PDF beneath the Report title.
- Select Save XLSX to export the Report as a spreadsheet document.
- This option is available in List and Bowling view.
- Only visualized columns will be included in the export.
- When the Report is in Bowling view, only the first page of results will be exported.
- Select Copy to Board to add the Report as a Card on a Board.
- In the resulting window, select a Board. All Boards that you have permission to edit will appear as options.
- Select Copy to add the Report to your selected Board. All filters and columns included on the Report will be carried over to the Card.
- The Report Card will appear at the Board's top left corner.