
/Ofie/Ofie%20Profile%20Pic.png?width=50&height=50&name=Ofie%20Profile%20Pic.png) Important: The features described on this support page require Charts to be enabled for your organization.
Important: The features described on this support page require Charts to be enabled for your organization.
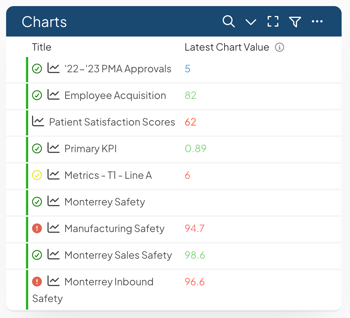
The Latest Chart Value column lets you see the most recent value of a Chart's Data Series directly in an Item List, so you can scan a whole list of Charts and immediately see where things stand, without opening each one individually.
Where this column is available
The Latest Chart Value column can be added to any Item List in List, Tree, or Gantt View. For instructions on adding a column to your list, see:
Once added, the column shows the latest value from whichever Data Series is selected in that Chart's Latest Chart Value Series setting.
Pro Tip: If a Chart doesn't have a Data Series selected for this column yet, KaiNexus automatically uses the left-most Data Series with actual data on that Chart, if one exists. You aren't required to configure anything before the column starts showing values.
Choosing which Data Series is shown
Each Chart has one Data Series that appears in the Latest Chart Value column. You select this Series once per Chart, and it applies anywhere the Chart appears in a list.
To choose the Data Series:
- Open the Chart Item (or a Chart Card), and open its Chart Options.
- Find the Latest Chart Value Series dropdown.
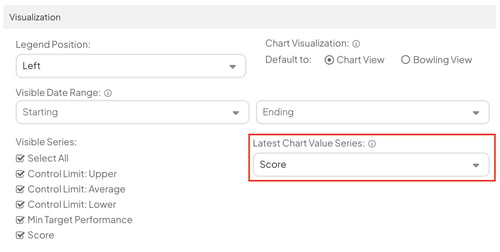
- Select the Data Series you want reflected in the column.
A couple of things to know about this setting:
- Only one Data Series can be displayed in the column at a time.
- The dropdown only includes the Chart's regular Data Series. Threshold, Bowling, Control, Calculated, and Accumulated % (Pareto) series are not available because they represent calculated or reference values rather than tracked data.
Pro Tip: If your Chart uses a Threshold or Bowling Series that colors values based on whether they meet a target, the Latest Chart Value column uses the same coloring. This lets you see whether the latest value is on or off target without opening the Chart.
Exporting the column
The Latest Chart Value column is included when you export an Item List to PDF.
For XLSX exports, the column is only included if you export with Include Current Columns selected. If you export with Include All Columns instead, the Latest Chart Value column will not be included.