
Compare and analyze the outcomes of your organization's Items.
The Impact Summary Report shows you the cumulative outcomes of your organization's Items.
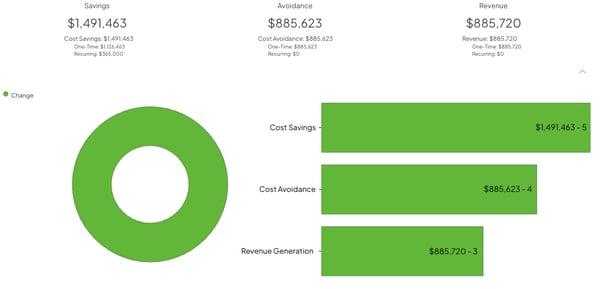
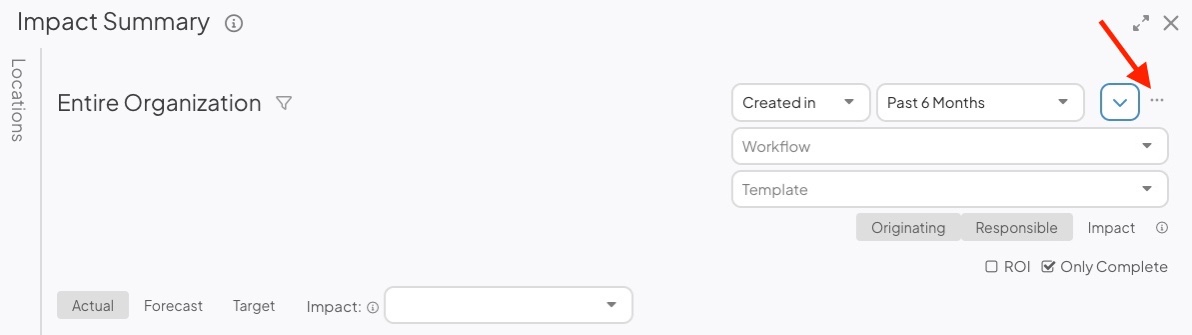
Example of an Impact Summary Report. Impact Categories are listed across the top of the Report and individual Impacts are displayed on the bottom right in bars. The pie chart represents the percent of Items that resulted in Change.
Who can access this Report?
Anyone with the "View Report Data" and "View Impact" permissions will be able to see this Report.
This Report can be accessed under the Impact section of the Reports page. It can also be:
Working with the Report
- Understand the Report's views
- Use filters to control which data are referenced by the Report
- See a list of Items referenced by the Report
- Share the Report
The views
If your organization is not using the Advanced ROI module, this Report will only have one view.
If your organization is using the Advanced ROI module, this Report will have three views:
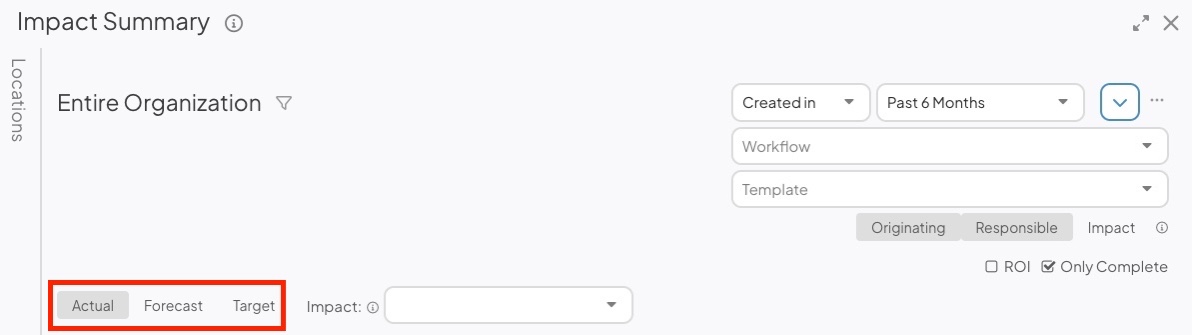
- Actual: Pulls data from Items' Actual Resolutions to calculate their total impact.
- Forecast: Pulls data from Items' Forecast Resolutions to calculate their total forecasted impact.
- Target: Pulls data from Items' Target Resolutions to calculate their total targeted impact.
There are three main components to this Report:
- The Cost Savings, Cost Avoidance, Revenue Generation, Time Savings, Cycle Time, and Lead Time Impact Categories are listed across the top of the Report.
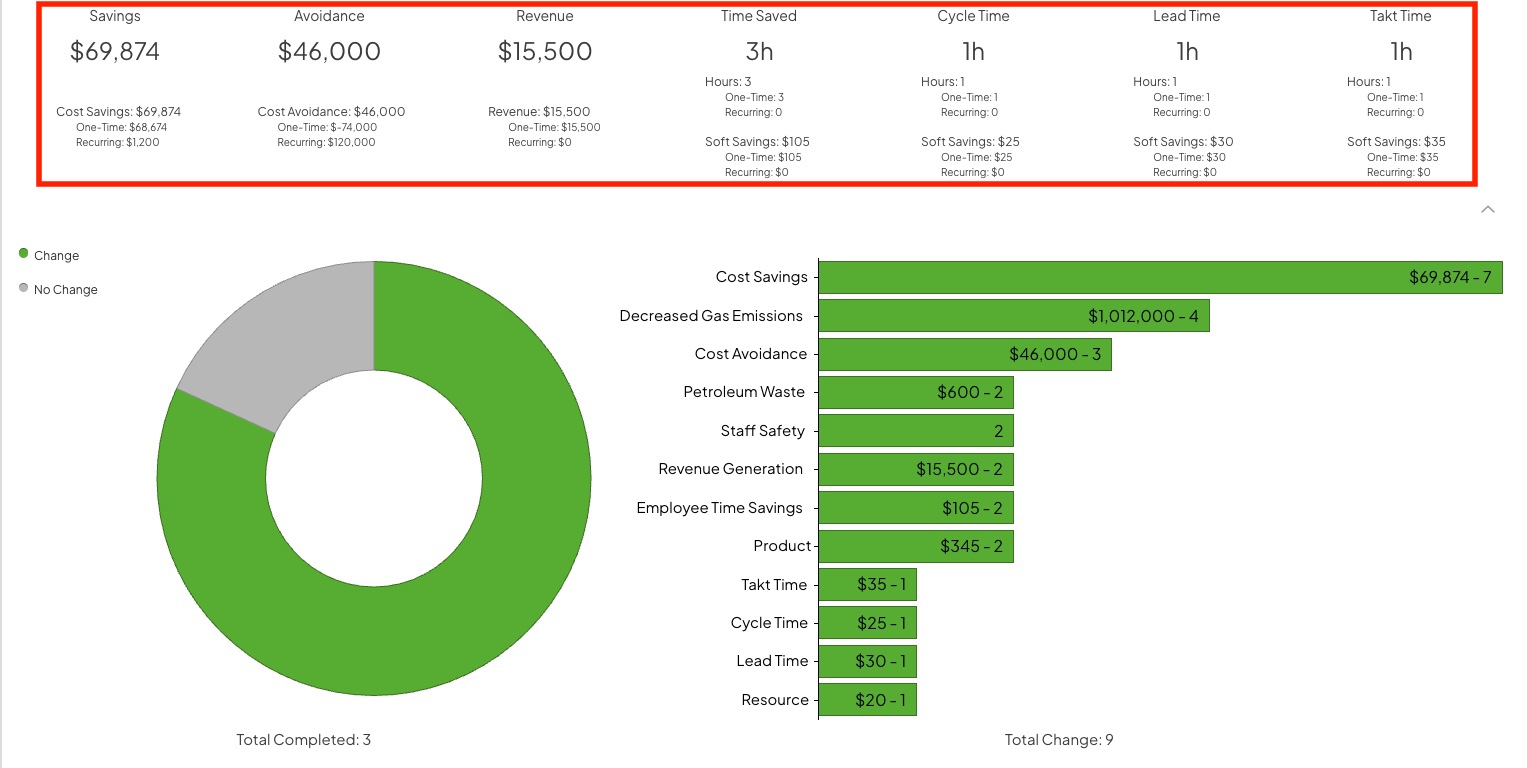
- Some impact types, such as Cycle Time and Lead Time, will only be listed if your organization is using the Advanced ROI module.
- Hover over any of the impact totals to see its details, or click the caret icon on the far right of the totals to expand their details all at once.
- The pie chart shows how many Items resulted in a change, no change, or your organization's customized third option. If no Items had one of these outcomes, that segment will not be included in the chart. The total number of completed Items is listed below the chart.
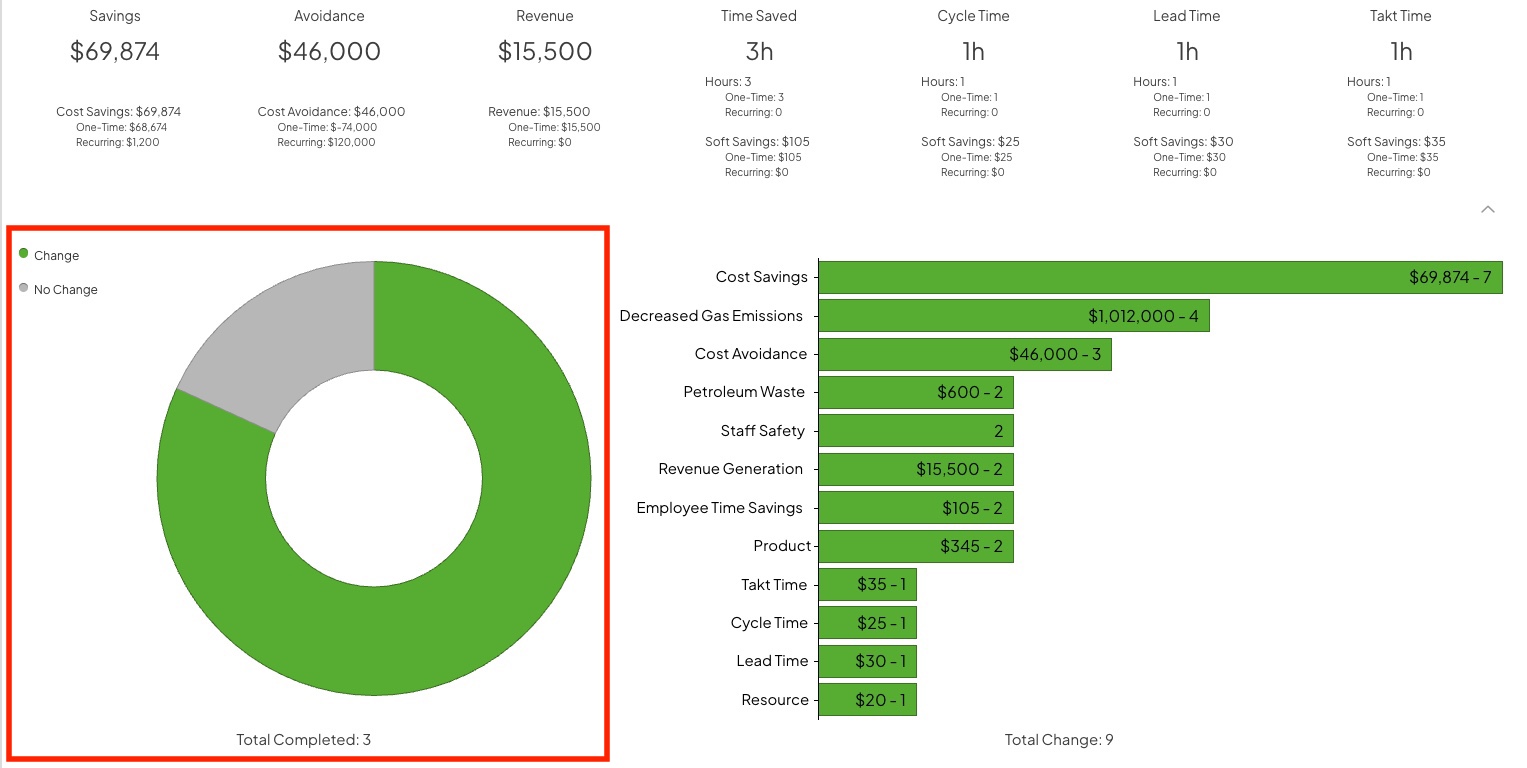
- Hover over any of the pie chart's segments to see the percentage of completed Items with that outcome.
- Click the No Change segment to display all the "no change" reasons in the bar chart.
- Click the Change segment to display all the "changes" or impacts in the bar chart.
- Click the Third Option segment to display all the "third option" reasons in the bar chart.
- The Impact Bars show the number of Items in which each Impact Type was logged in the Resolution. The total number of Items that resulted in change are listed beneath the bars.
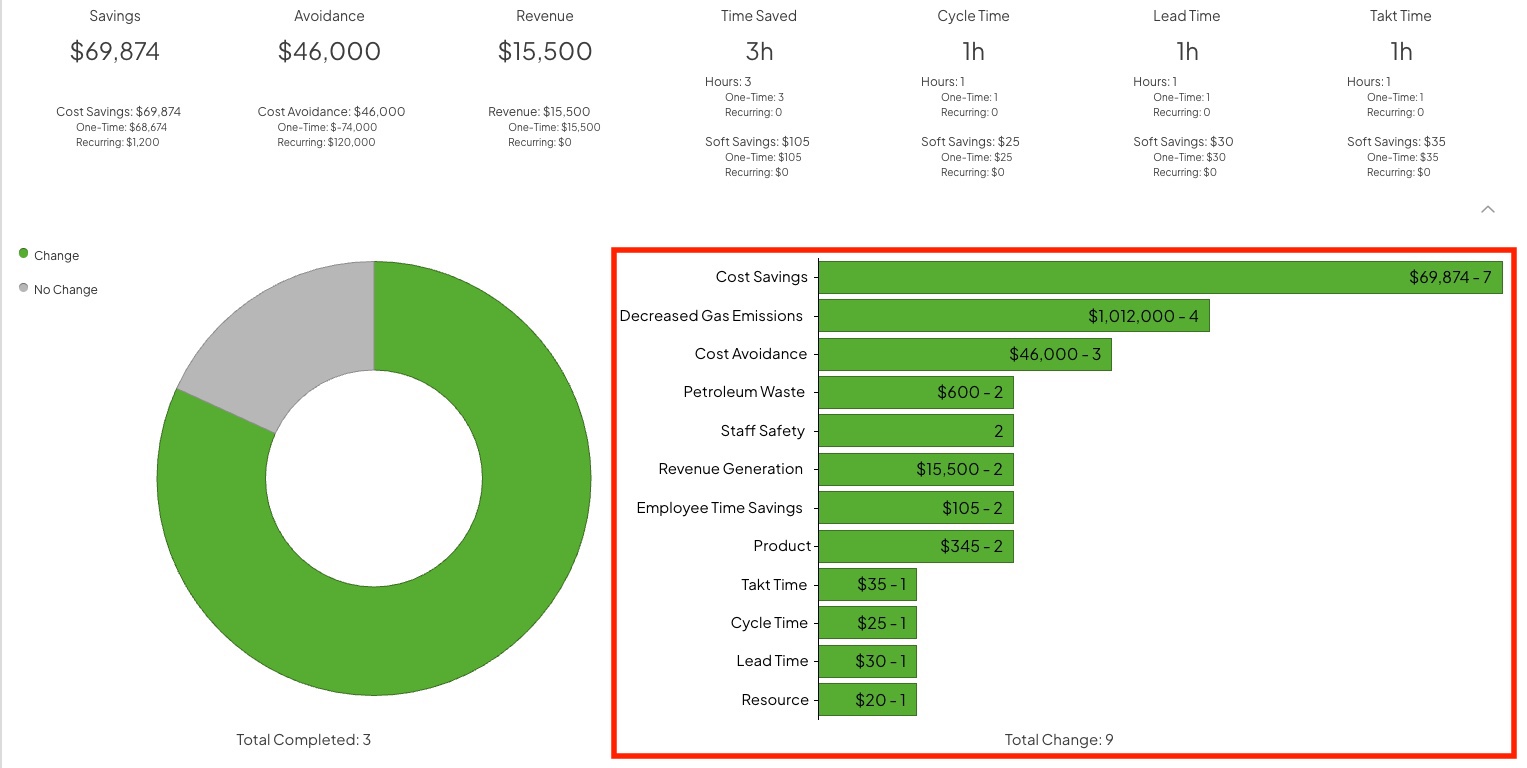
- The soft or hard savings associated with each Impact Type will be listed beside the number of Items contributing to the total value.
The filters
Any relevant filters in use on the main Reports screen will be automatically applied to this Report but can still be configured as needed.
- There are two date-based drop-downs. First is the "Reference Date" drop-down and second is the "Range" drop-down.
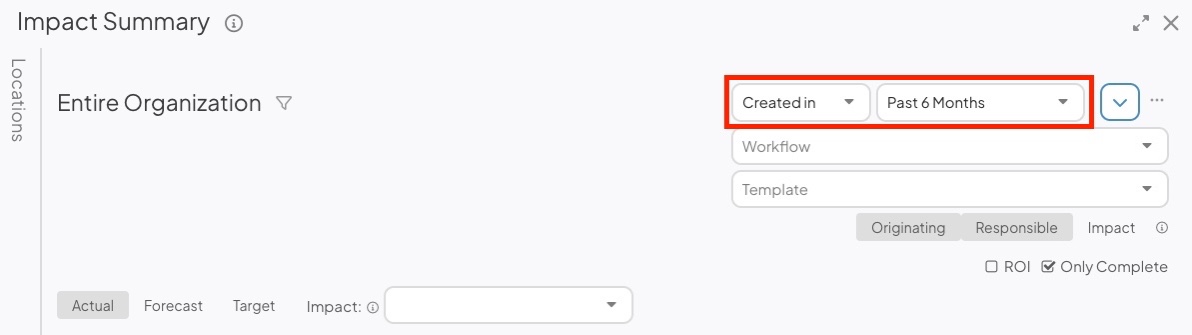
- Reference Date: Expand the drop-down to choose which type of date should be referenced by the Report. For example, select "Created in" if you want the Report to reference only those Items that were created in the specified date range.
- Range: Expand the drop-down to choose the range of dates that should be included in the Report.
- All Time removes any date range parameters.
- Custom allows you to enter any date range you want.
- Past shows you a rolling date range that counts back from the current calendar date.
- Current shows you data for the current week, month, quarter, or year.
- Last shows you data for the previous week, month, quarter, or year.
/Ofie/Ofie%20Profile%20Pic.png?width=50&height=50&name=Ofie%20Profile%20Pic.png) Pro Tip: The Last YTD option helps you set a date range matching the current year-to-date period but for the previous year instead. For example, if it is March 15th, 2024, and you select Last YTD, your Report will cover data from January 1st, 2023, to March 15th, 2023. This logic is also true for the Last MTD and QTD options.
Pro Tip: The Last YTD option helps you set a date range matching the current year-to-date period but for the previous year instead. For example, if it is March 15th, 2024, and you select Last YTD, your Report will cover data from January 1st, 2023, to March 15th, 2023. This logic is also true for the Last MTD and QTD options.
- Workflow: Expand the drop-down to choose which workflows should be included in the Report.
- Template: Expand the drop-down to choose which Templates should be included in the Report.
-
Select Originating, Responsible, or Impact to decide whether the Report should reference Items from the Originating, Responsible, or Impact Location.
- By default, both Originating and Responsible will be selected.
- If Impact is selected, both Originating and Responsible will be toggled off.
- If no Location is selected in the Location Picker or Item Filter, the Originating, Responsible, and Impact toggles will not affect Report data.
- The ROI checkbox: This checkbox is only available if your organization is using the Advanced ROI module and if the Report currently includes data from Items with recorded Investments. When enabled, if will add an "ROI" percentage to the Report.
- The Only Complete checkbox: When enabled, this Report will only include data from completed Items; when disabled, it includes data from any Item that has a Resolution saved, regardless of status.
- Currency: This option is only available if your organization has multiple currencies enabled. By default, the Report will only show the financial impact of Items using your location's default currency. To change the Report's currency, expand the Currency drop-down and select the desired currency.
- Note: Changing the currency alone will not convert Impact data from one currency to another. It will display Impact data that was logged in the currency selected.
- Currency Conversion: Currency conversion is only available if your organization has multiple currencies and the Advanced ROI Module. When currency conversion is enabled, there will be two currency drop-downs.
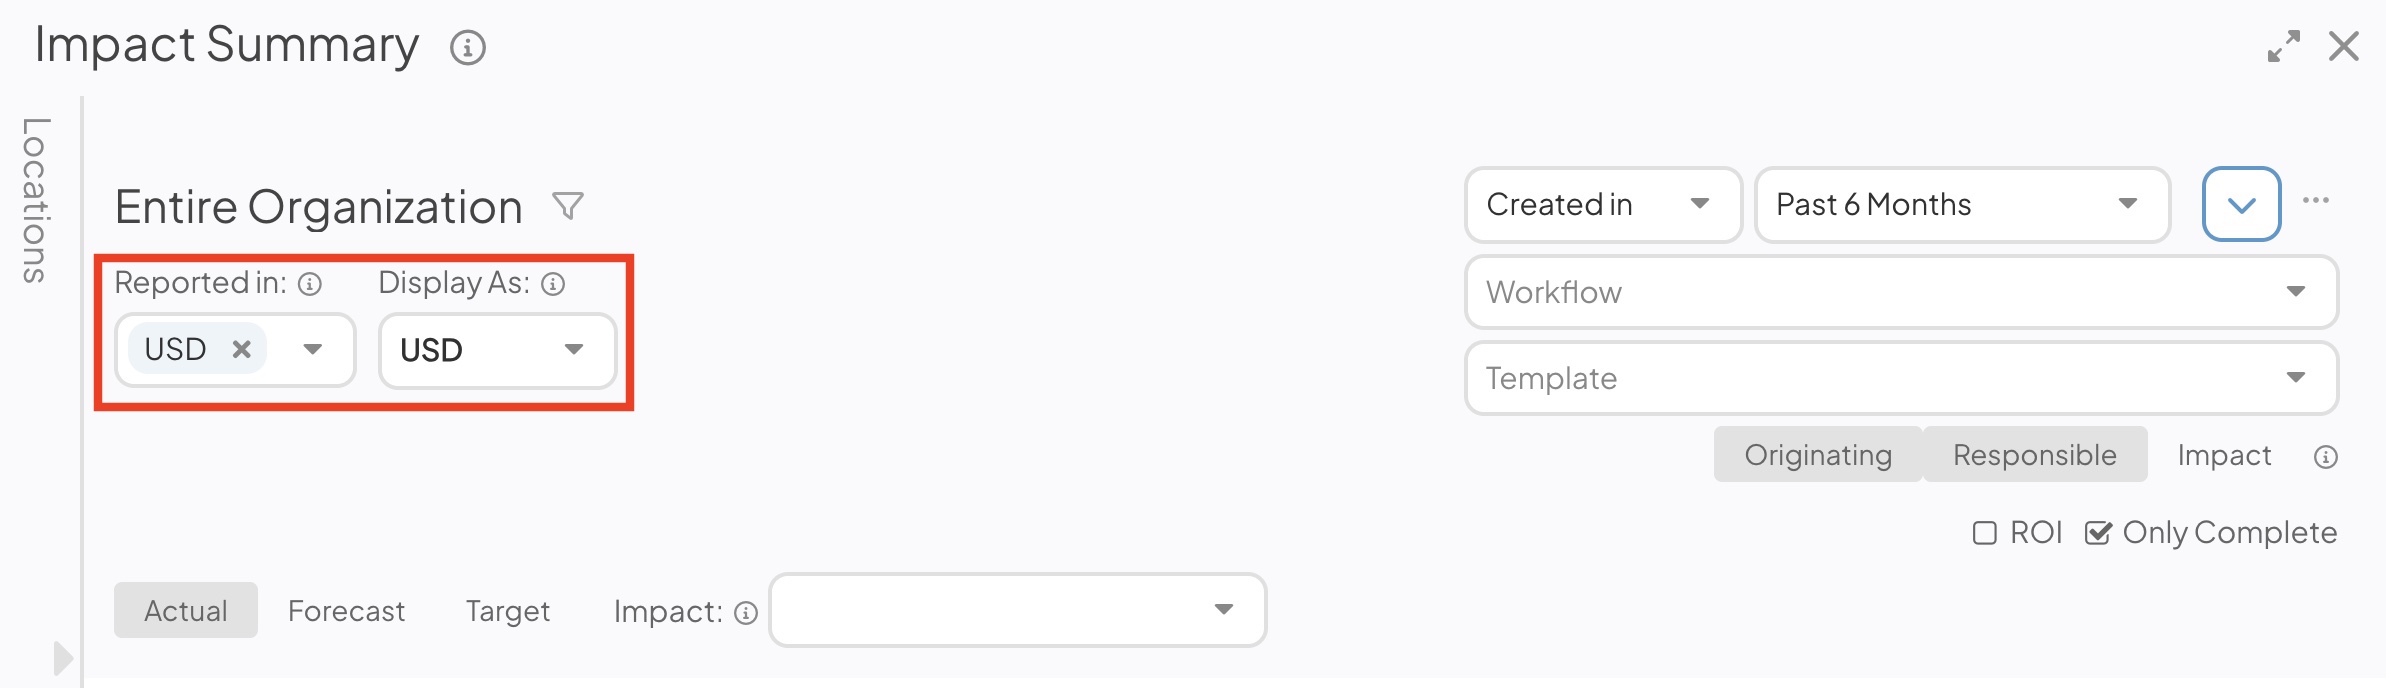
- Reported in: This drop-down determines which Impacts are included in the Report based on their original currency. When a currency is selected, the Report will include all Impacts logged in that currency. For example, if a project's Impact was recorded in USD, then USD must be included in this field for the project's data to appear in the Report.
- This drop-down is multi-select. If you want to consider all Impacts in your organization regardless of their currency, then select all options or choose Any Currency.
- By default, your Location's default currency will be listed.
- Reported in: This drop-down determines which Impacts are included in the Report based on their original currency. When a currency is selected, the Report will include all Impacts logged in that currency. For example, if a project's Impact was recorded in USD, then USD must be included in this field for the project's data to appear in the Report.
-
- Display As: This drop-down determines which currency the Report displays. All Impacts that match your filters will be converted to the currency selected. For example, if you choose USD and EUR in the "Reported in" drop-down and then you display the data as EUR, the system will convert USD Impacts to EUR. The Report will display both the Impacts initially recorded in EUR and the converted Impacts in EUR.
- This drop-down is single-select. The Report can only display data in one currency at a time.
- By default, your Location's default currency will be selected.
- Display As: This drop-down determines which currency the Report displays. All Impacts that match your filters will be converted to the currency selected. For example, if you choose USD and EUR in the "Reported in" drop-down and then you display the data as EUR, the system will convert USD Impacts to EUR. The Report will display both the Impacts initially recorded in EUR and the converted Impacts in EUR.
/Ofie/Ofie%20Profile%20Pic.png?width=50&height=50&name=Ofie%20Profile%20Pic.png) Pro Tip: The system will use your selection in the Reference Date drop-down when determining which Exchange Rate to use for the currency conversion. For example, if you select "Realized In," the Impacts are converted using the Exchange Rate active on their Realized Date. If you select "Created In," Impacts are converted using the Exchange Rate active during their Item's Create Date. Check out our article about setting your organization's Exchange Rates to view current and historical Exchange Rates configured by your organization.
Pro Tip: The system will use your selection in the Reference Date drop-down when determining which Exchange Rate to use for the currency conversion. For example, if you select "Realized In," the Impacts are converted using the Exchange Rate active on their Realized Date. If you select "Created In," Impacts are converted using the Exchange Rate active during their Item's Create Date. Check out our article about setting your organization's Exchange Rates to view current and historical Exchange Rates configured by your organization.
- Click the filter icon and the Item Filter window will open.
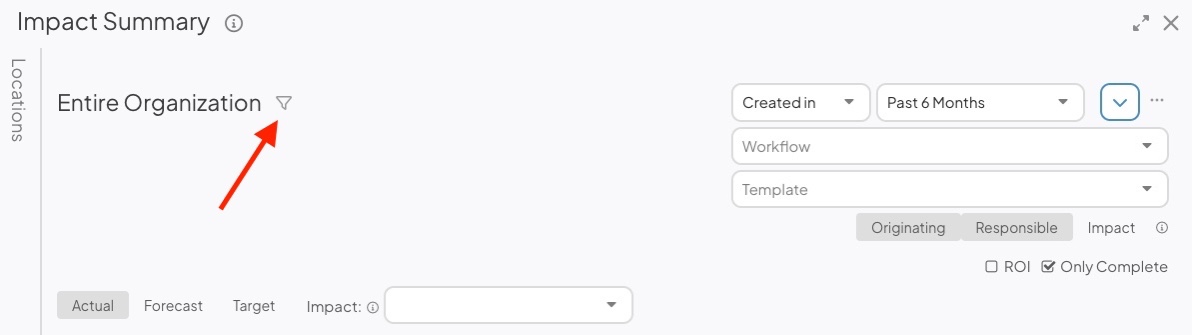
- Update the item filters to control which Items are included in the Report's metrics.
- Click Save.
- Click the Locations panel on the left side of the Report to expand it.
- Filter the Report by Location and only Items tied to the selected Locations will be included in the Report.
- Impact: Expand the drop-down to choose the Impact(s) which should be shown on the Report.
- Only Impact Categories that correspond to the Impacts selected in this drop-down will be listed at the top of the Report.
![]() Pro Tip: If you choose the Impact(s) in the Item filter instead, the Report will only include data from Items that have those impacts but will still show all impact types.
Pro Tip: If you choose the Impact(s) in the Item filter instead, the Report will only include data from Items that have those impacts but will still show all impact types.
See a list of Items referenced by the Report
There are several lists that can be generated by this Report:
- Click Total Completed under the donut chart to open a list of completed Items.
- Click any of the bars in the bar chart to open a list of all Items that resulted in that impact type or reason.
- Click the Total listed below the bar chart to open a list of Items that resulted in the selected outcome.
Share the Report
To share the Report, select the ellipsis icon. In the resulting drop-down menu, you can export the Report as a PDF or copy it to a Board.
- Select Print/Save PDF to export the Report as a PDF. The "Print" window will open.
- Page Size: Expand the drop-down to choose your preferred page size.
- Scale: Expand the drop-down to choose the scale percentage. This allows you to fit more content on a single page. For example, selecting 50% doubles the amount of content you can fit on one page. Make sure to select "Fit to page" in your browser's print settings.
- Click either Portrait or Landscape to choose the PDF's orientation.
- Click Print.
The Location of the Report will appear on the exported PDF beneath the Report title.
- Select Copy to Board to add the Report as a Card on a Board.
- In the resulting window, select a Board. All Boards that you have permission to edit will appear as options.
- Select Copy to add the Report to your selected Board. All filters and columns included on the Report will be carried over to the Card.
- The Report Card will appear at the Board's top left corner.
Impact Summary Report Cards
Impact Summary Reports can also be added as a Card on Boards.
When adding an Impact Summary Report Card to a Board, you use the same filters discussed in this article to build the Report. However, you will have an additional Show option that determines which information is displayed on the Card.
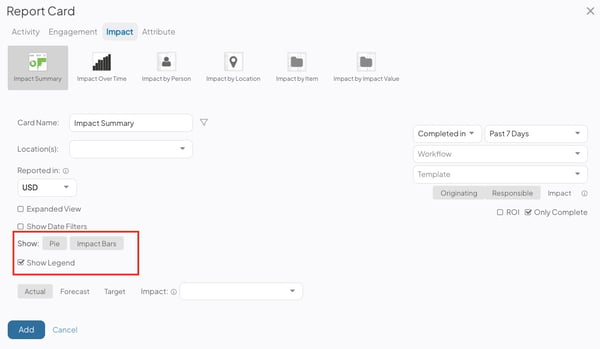
- Pie: When selected, the Change % pie graph will be displayed on the Card.
- The Show Legend checkbox: When checked, a legend for the Pie graph will be included that counts the number of Items that resulted in Change or No Change.
- Impact Bars: When selected, the bar for each Impact selected in the Impact dropdown will be shown on the Card.